
CODEX33
Unbiased crypto education, free for everyone. Just shared knowledge, never financial advice.
Disclaimer
CODEX#33 is for education only. Not financial advice. Trading is risky and losses can be large. Past results mean nothing.Every decision is your own. By reading, you accept the risks and use this at your discretion.
Tools
Tools cut the noise and keep charts clear. The right ones show where price reacts and help you trade with focus.
Market24hClock shows live market sessions in one glance. It highlights overlaps, cuts confusion, and keeps your trading timed right.
WEEX is one of the top exchanges I trade on. Solid liquidity, smooth execution, and a platform that works for both spot and futures. Reliable, simple to use, and built for real traders.
The Blockchain Masons, (@Masons_DAO) are a collective of traders sharing calls, tools, and market structure in real time. It’s a space on X where you can learn how to trade with real traders, with a premium tier for deeper insights.
The Blockchain Masons Discord is where traders connect, share setups, and learn together. Plenty of free channels to get started, plus a premium tier with daily calls from their top traders.
Nexa is Sui’s all-in-one terminal; charts, data, and execution in one place. Fast settlement, low fees, and cross-device access make it a true daily driver for DeFi traders.
TradingView is the default platform for most traders. Clean charts, endless scripts, and real-time ideas make it the backbone of retail trading. Free is enough to start, but limits push pros to upgrade. Despite flaws, it’s still the first tab open.
CoinGlass is a core dashboard for derivatives traders. It aggregates futures and options data and makes liquidation pressure clear with real-time overlays. Built for traders in the order book, not casuals.
Dexscreener is the go-to dashboard for on-chain traders. It tracks live pairs across multiple DEXs and makes liquidity, volume, and price action clear. The edge is speed, new tokens, flows, and moves shown in real time. Built for traders who live on-chain, not for casual chart watchers.
The Candlestick Trading Bible is a classic reference for pattern recognition. A solid resource to study candlestick behavior and build a foundation for reading price action.
CryptoBubbles visualizes the market in a simple bubble chart. Size shows market cap, color shows performance, making it easy to spot winners, losers, and trends at a glance.
The CryptoCraft Calendar tracks key economic events that move markets. A simple way to stay ahead of interest rate decisions, jobs data, and global news that impact trading.
Aggr is a trade aggregation tool with advanced analytics and its legendary sound feedback. Use it as a simple trade stream with audio or expand it into a full market monitoring setup with custom presets.
Ground.news tracks how stories are covered across media. It shows bias, political lean, and where narratives diverge. Useful for traders who want signals without getting trapped in one news bubble. Less hype, more context.
Velo.xyz is a clean on-chain dashboard that tracks flows, positioning, and sentiment across crypto markets. It cuts through noise with real-time data on funding, open interest, and cross-venue activity. Simple visuals, quick updates, and no clutter, just the metrics that move price.
A multichain NFT hub built around ecosystems like Sui, Aptos, and NEAR. Trade, create, or build with APIs and SDKs that cut friction and keep it fast.
Token Terminal is a full stack onchain data platform focused on standardizing financial and alternative data for the most widely used blockchains and decentralized applications.
CoinAnk is a clean dashboard for derivatives traders. It tracks futures, options, and leverage metrics like heatmaps, positioning, and open interest, simple, accessible, and free.
SosoValue is a one-stop research platform for crypto investors. It brings together market data, on-chain analytics, and financial insights in one clean dashboard.
Candlestick Patterns
How do you want to speak if you don’t understand the language? These patterns are the alphabet of trading.
Bullish Candle
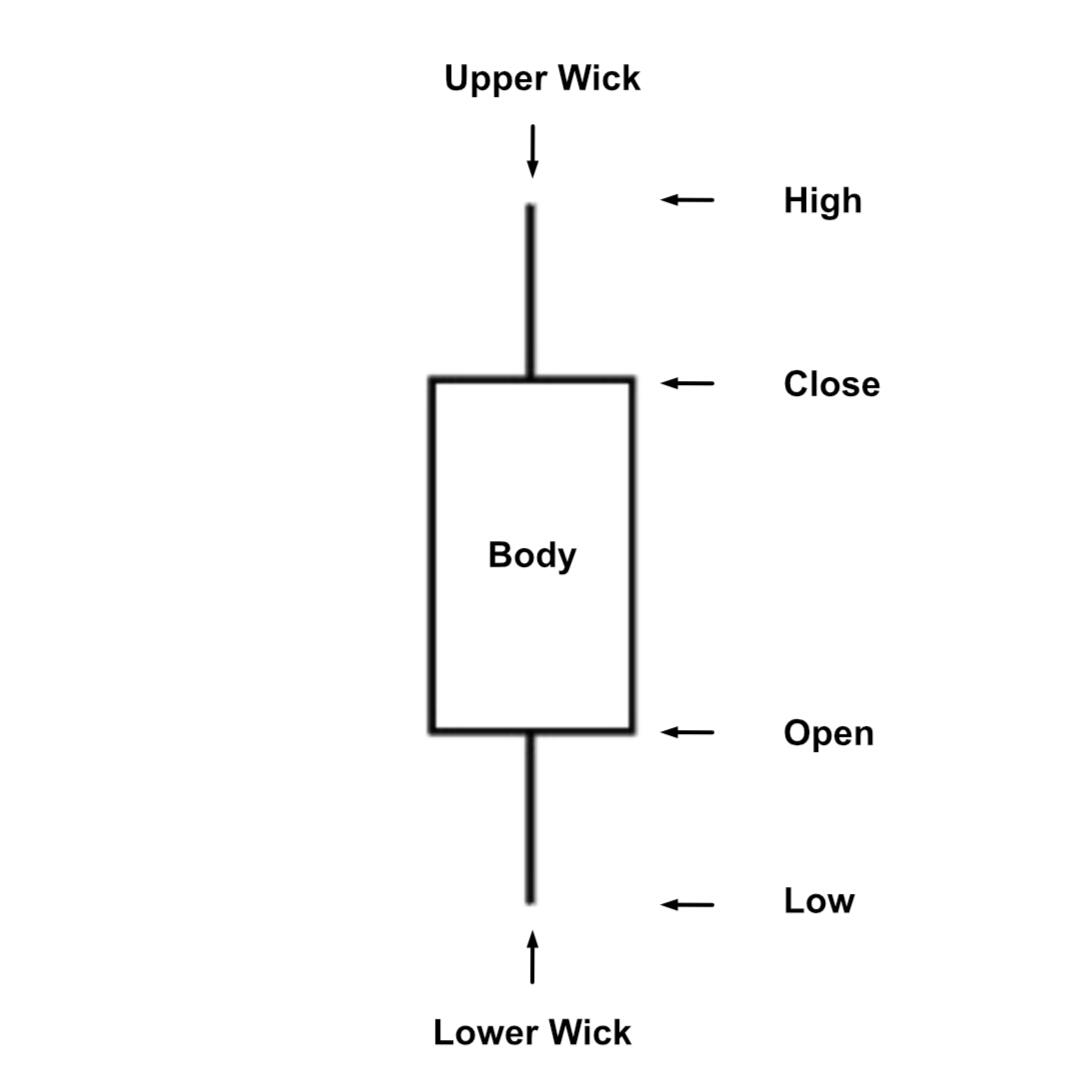
A bullish candle closes above the open, showing buyers in control. The body marks open to close, the wicks show the session’s high and low.Color doesn’t matter, pressure came from the buy side.
Bearish Candle
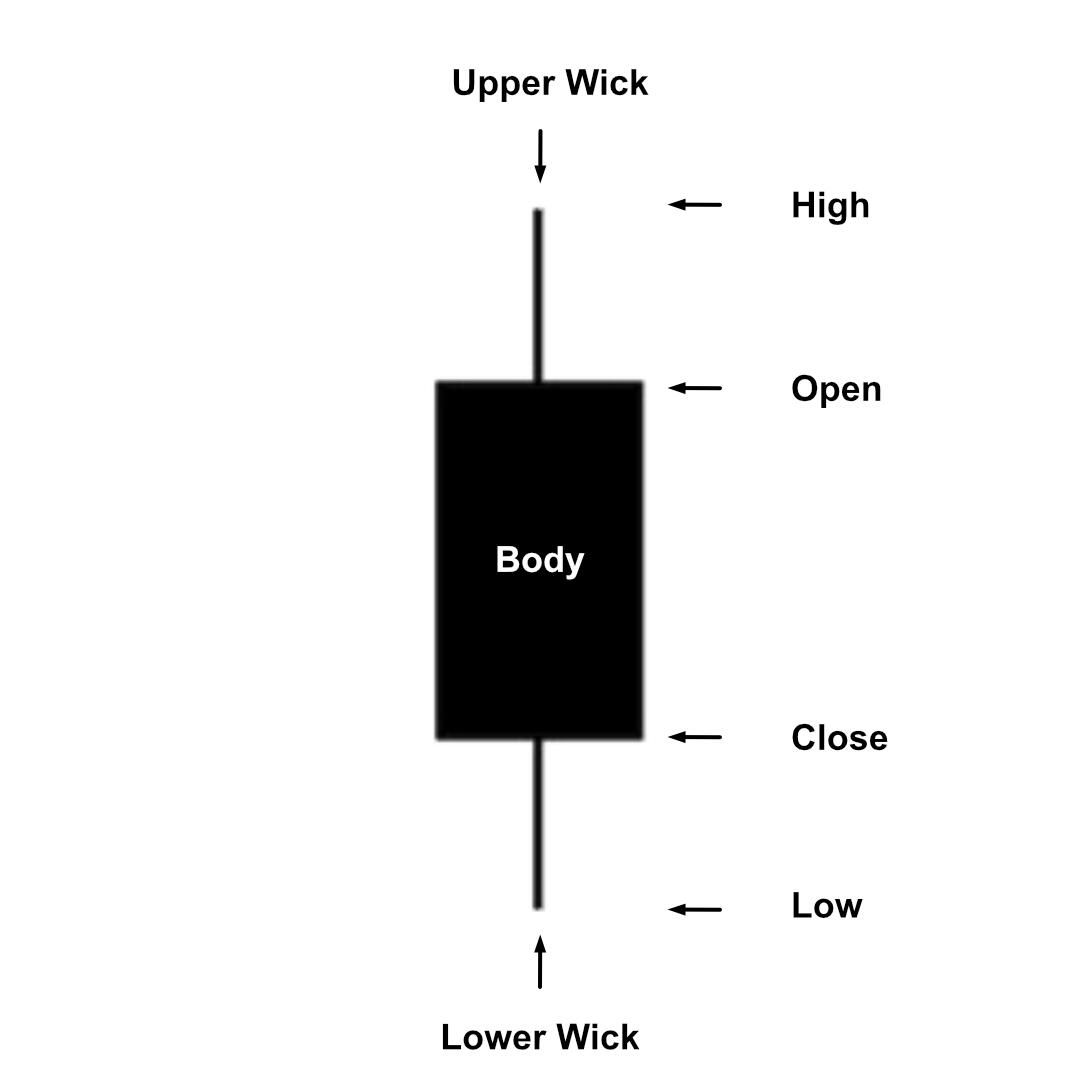
A bearish candle closes below the open, showing sellers in control.Color doesn’t matter, the pressure came from the sell side.
Long Body Candle
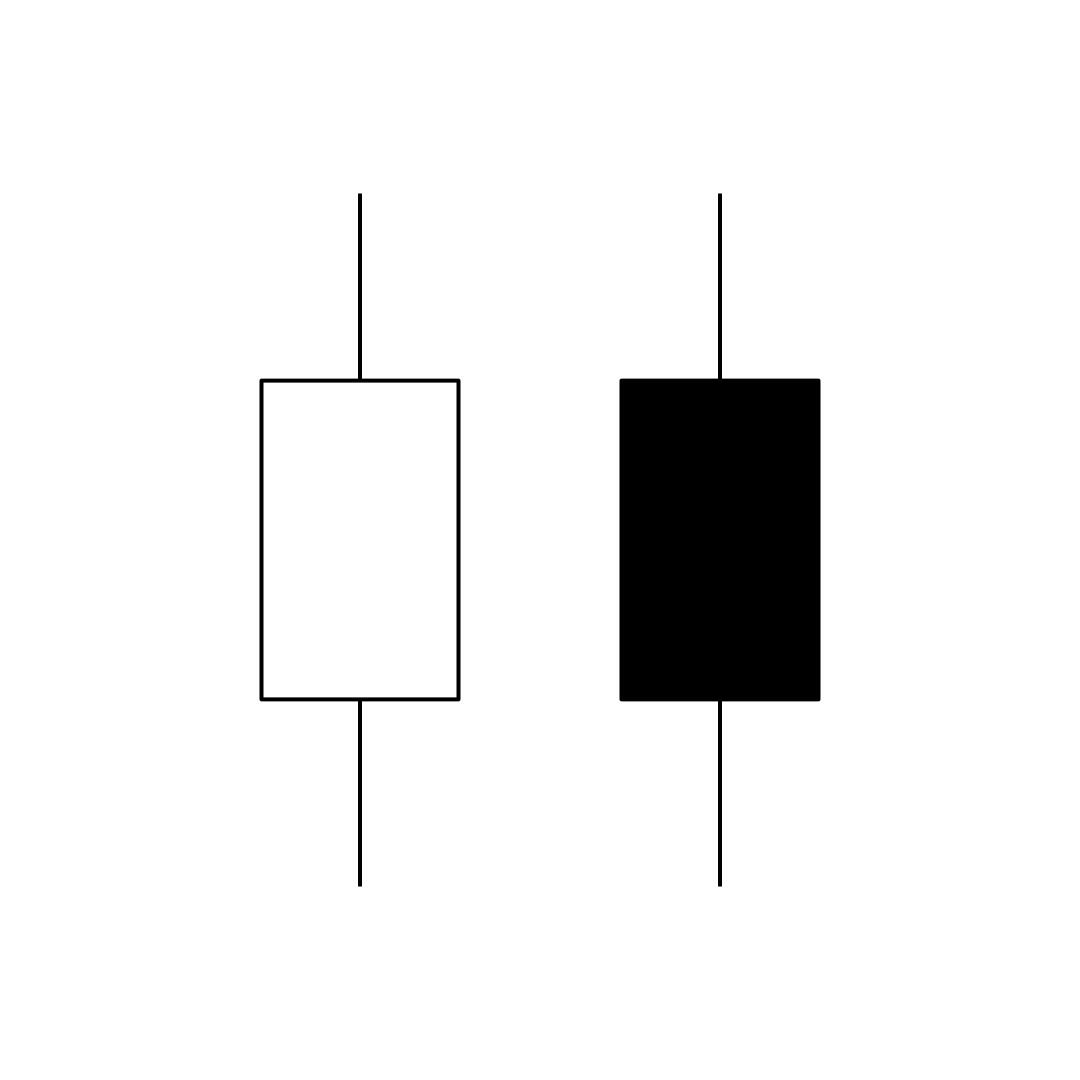
A long body shows decisive movement. Close above the open and buyers dominated. Close below and sellers did. The bigger the body, the stronger the conviction.
Short Body Candle
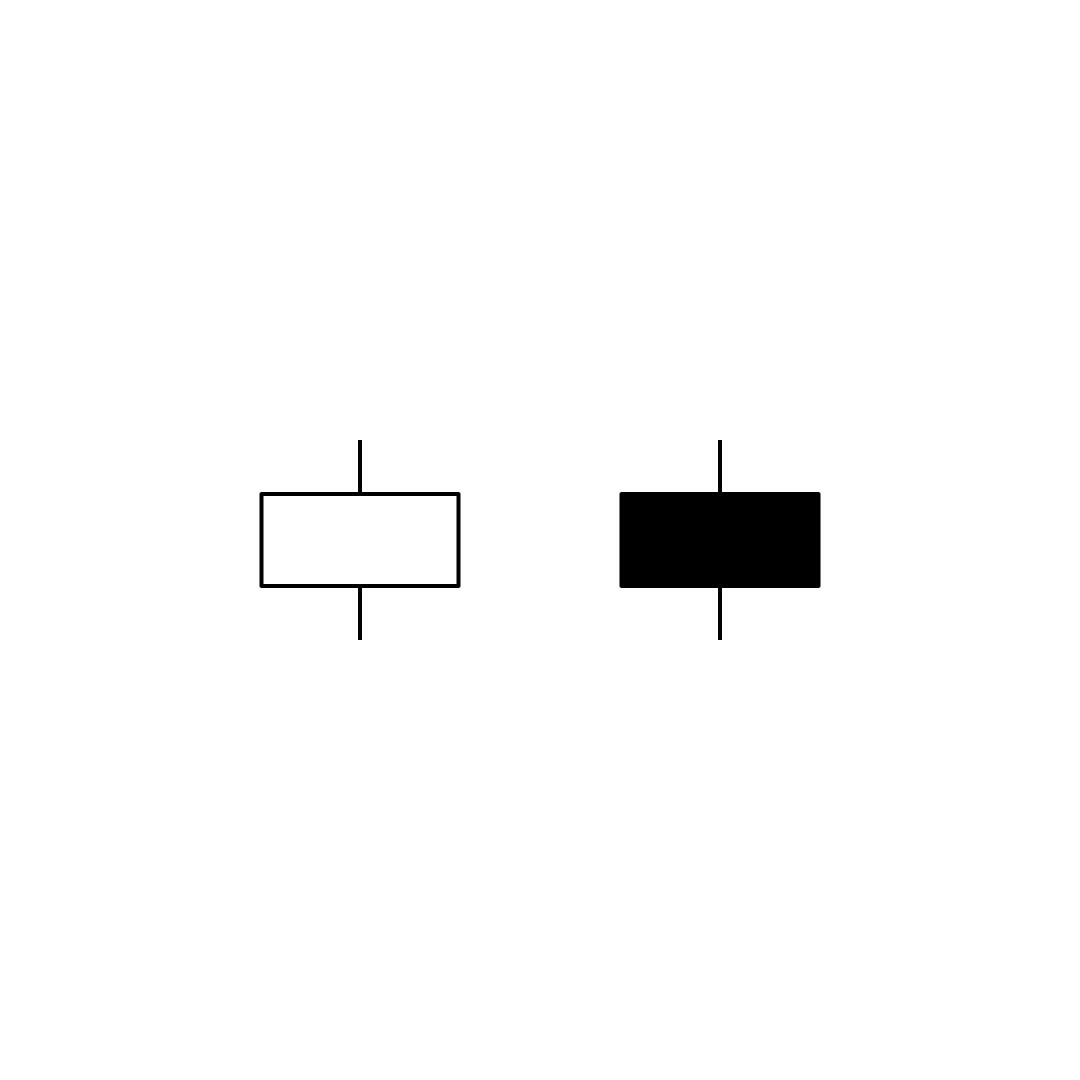
A short body shows weak movement and indecision. Neither side in control, momentum stalled.
Upper Wick
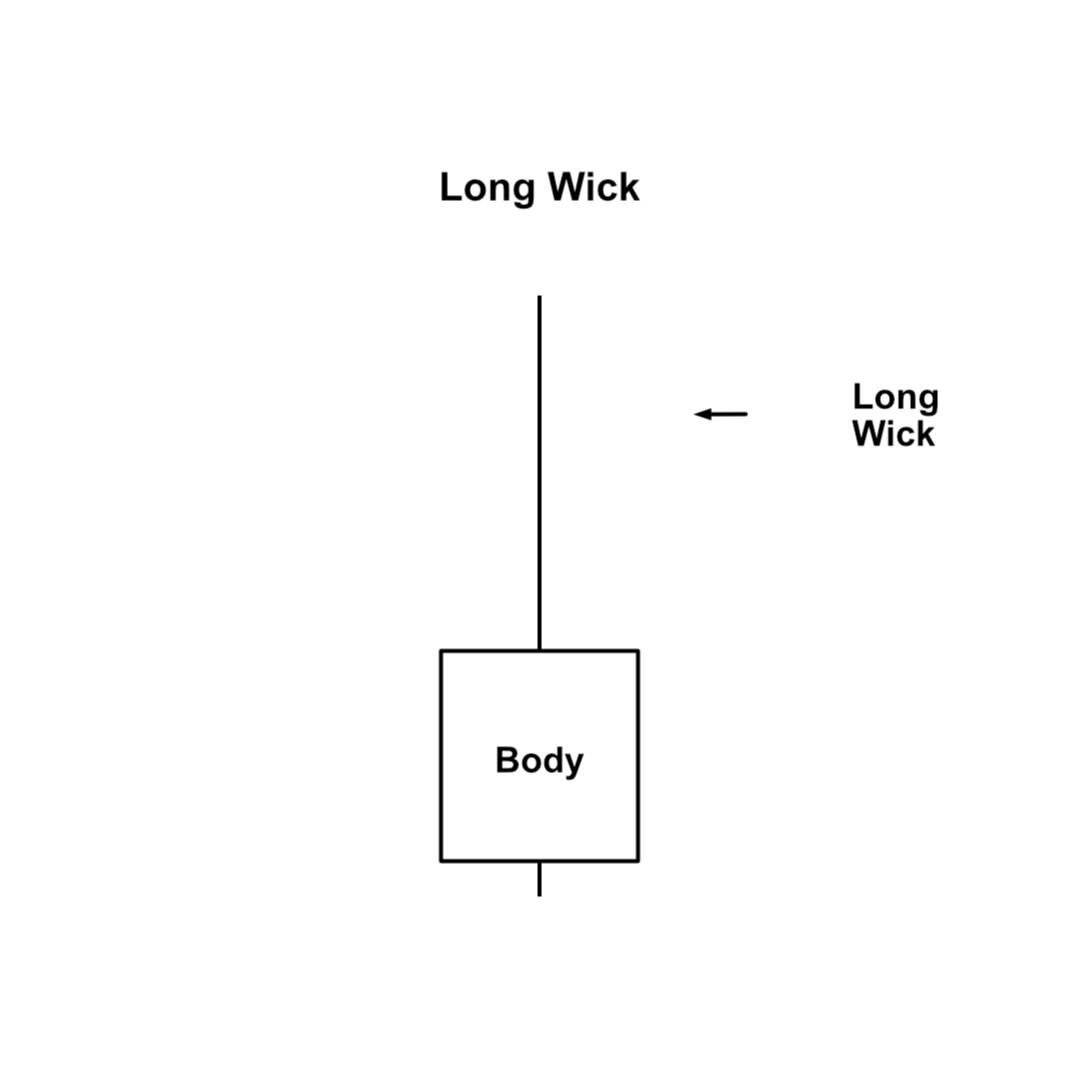
A long upper wick shows buyers pushed higher but lost control. Sellers forced it back down, rejecting higher levels and signaling weakness.
Lower Wick
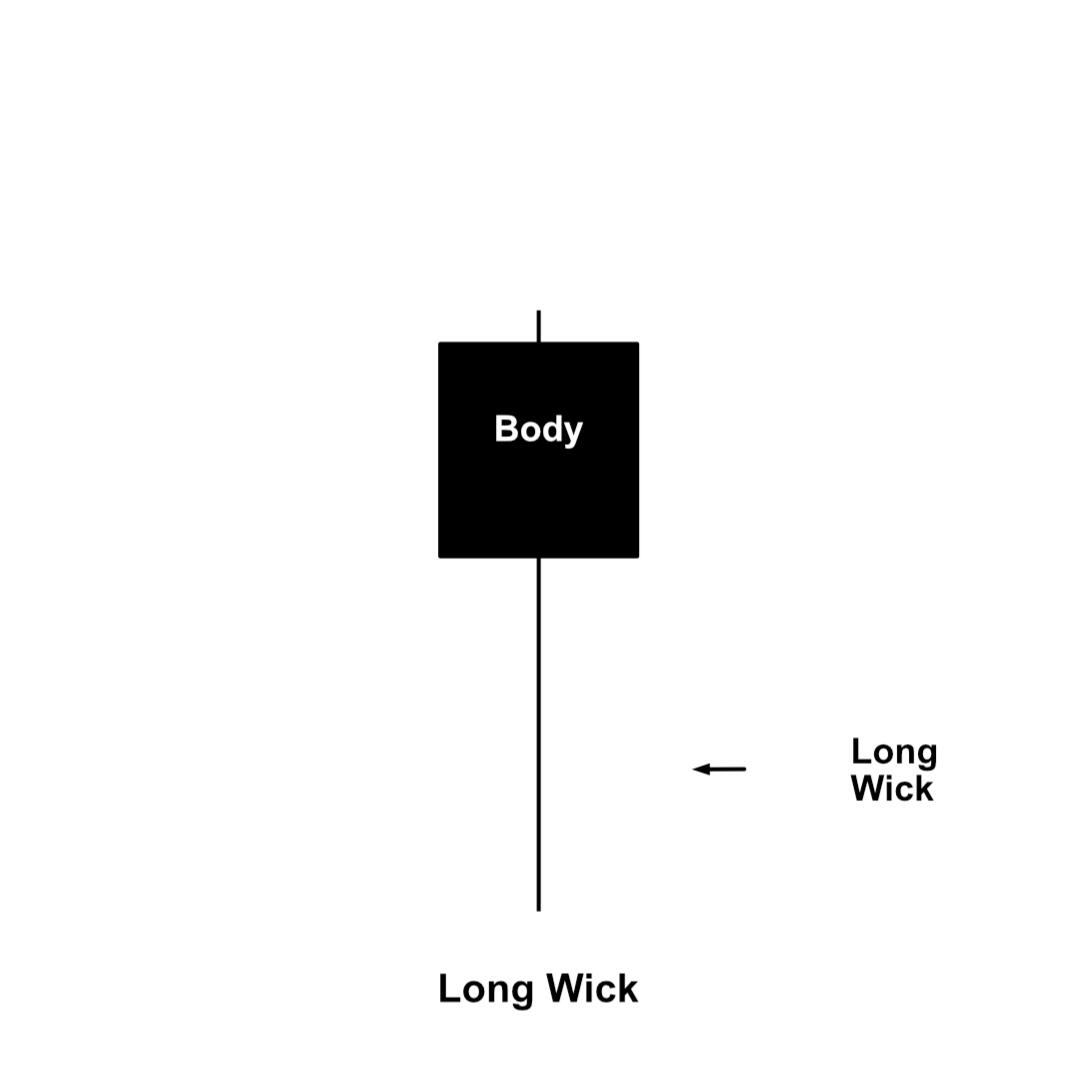
A long lower wick shows sellers pushed down but lost control. Buyers forced it back up, rejecting lower levels and signaling strength.
Bearish Engulfing Candle
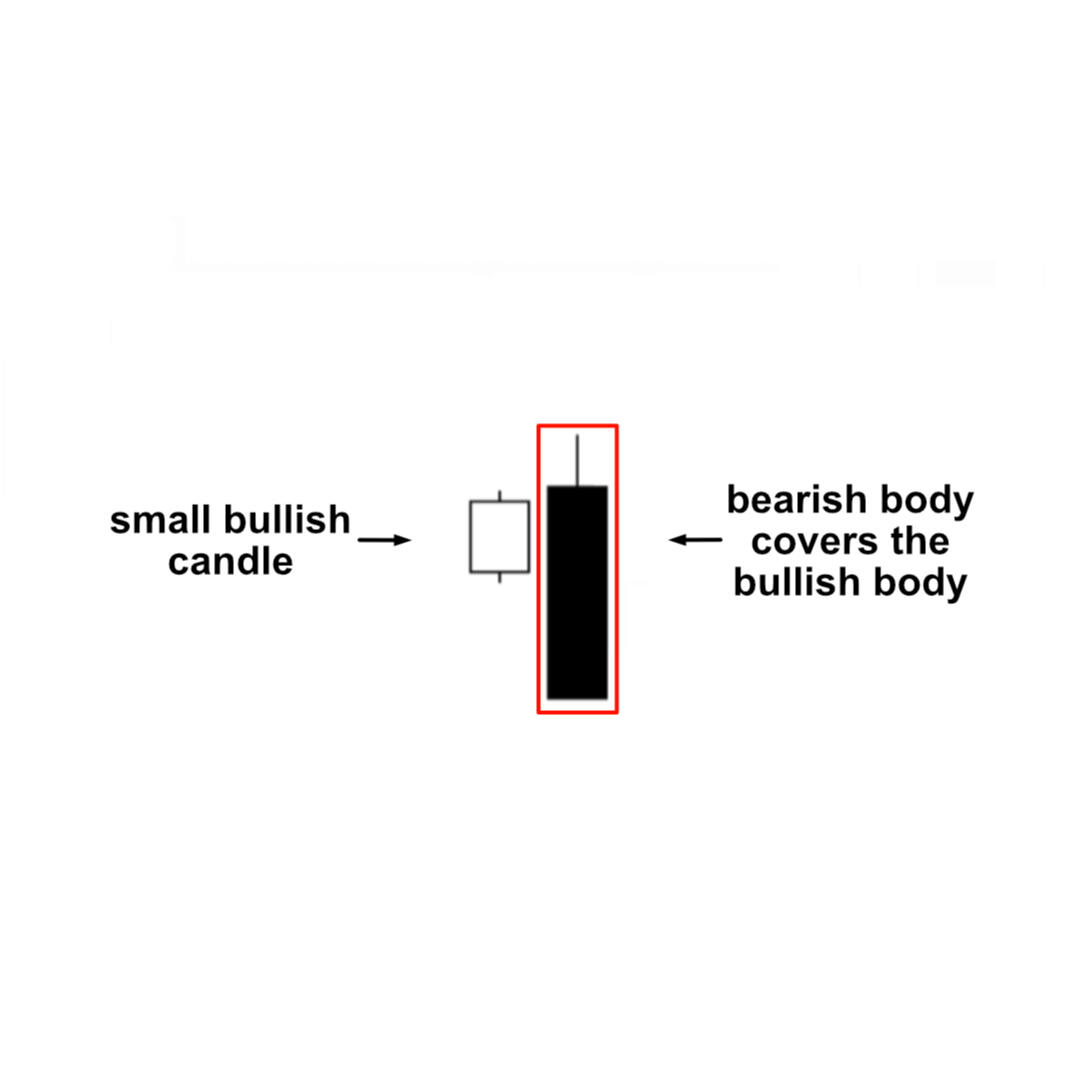
A bearish engulfing forms when a larger red candle covers the prior smaller one. It shows sellers overpowering buyers and often marks momentum shifting at the end of an uptrend.
Bearish Engulfing Pattern
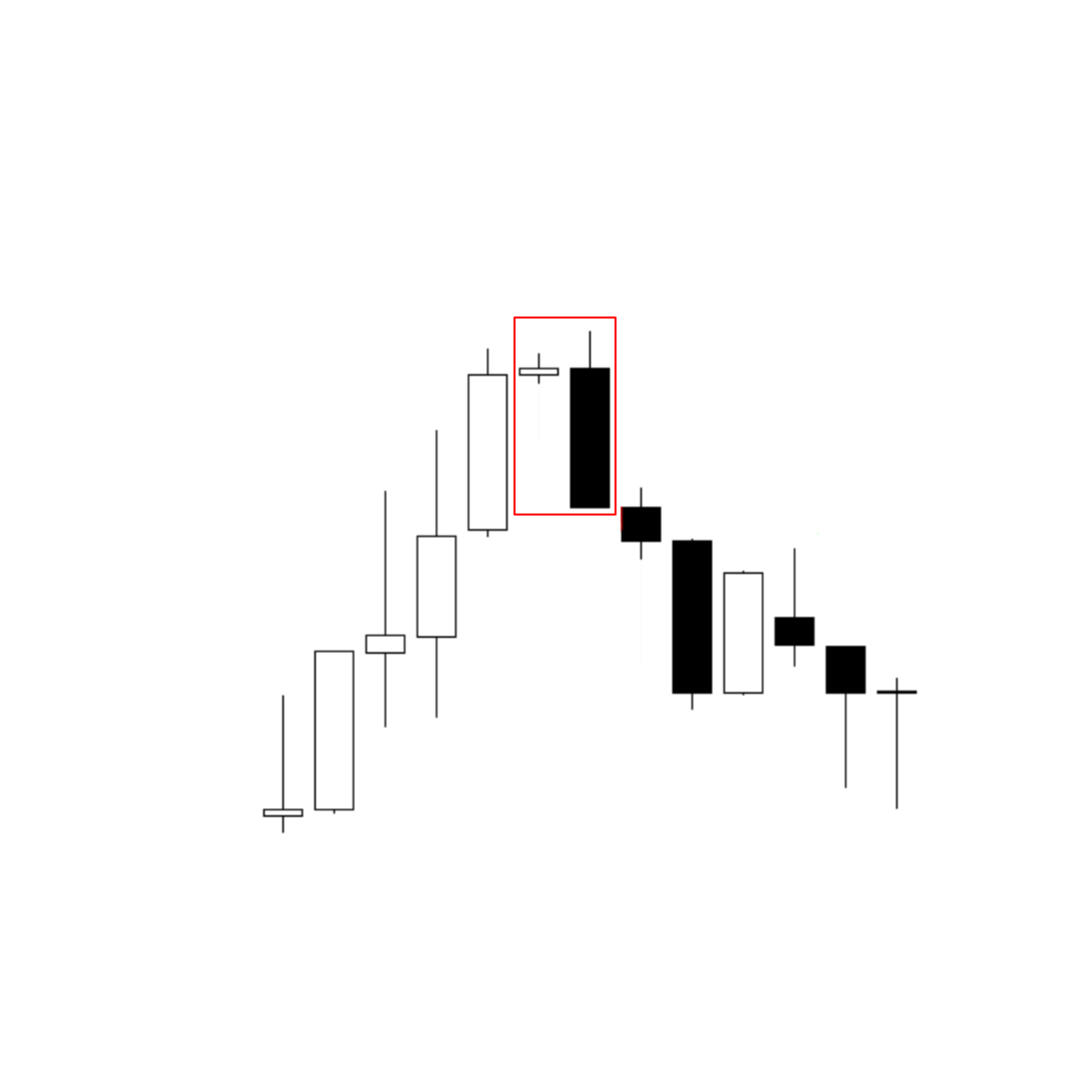
At the end of an uptrend, a bearish engulfing forms when a larger red candle covers the prior smaller one. It signals sellers taking control and a possible reversal, best confirmed with volume or structure.
Bullish Engulfing Candle
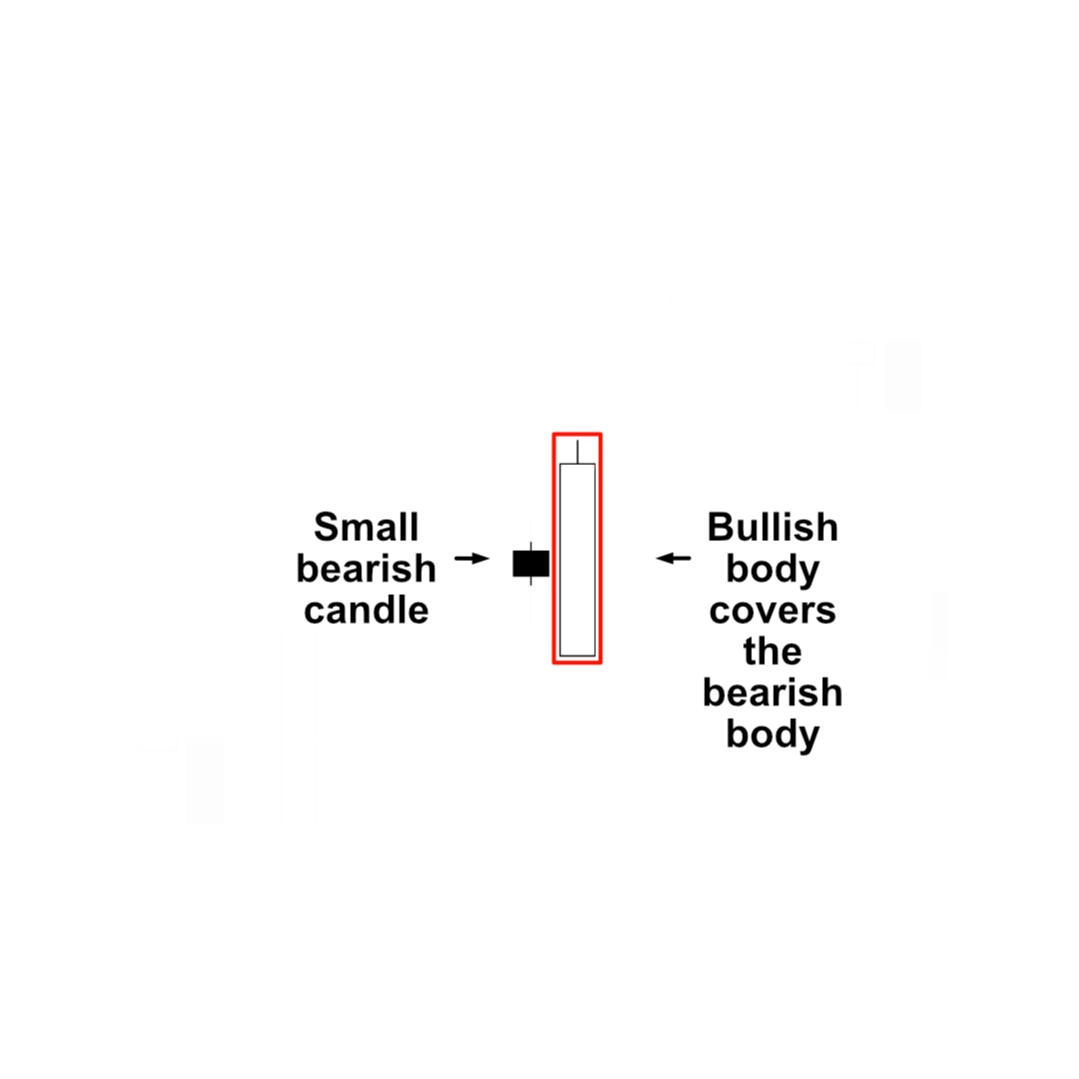
A bullish engulfing forms when a larger green candle covers the prior smaller one. It shows buyers taking control and often signals continuation in an uptrend or reversal at a downtrend’s end.
Bullish Engulfing Pattern
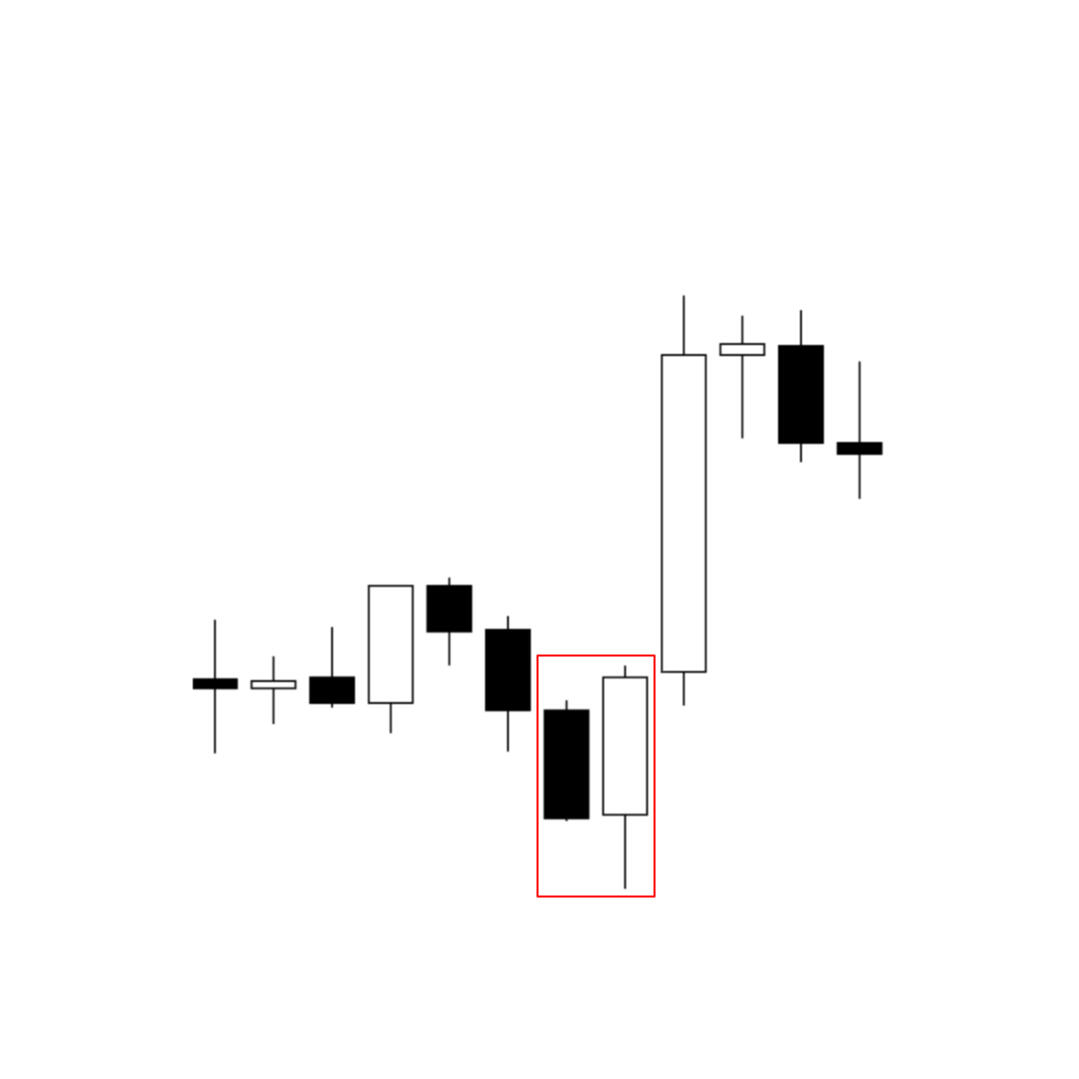
At a downtrend’s end, a bullish engulfing forms when a larger green candle covers the prior smaller one. It signals buyers taking control and a possible reversal. Best confirmed with volume or structure.
Doji Candle
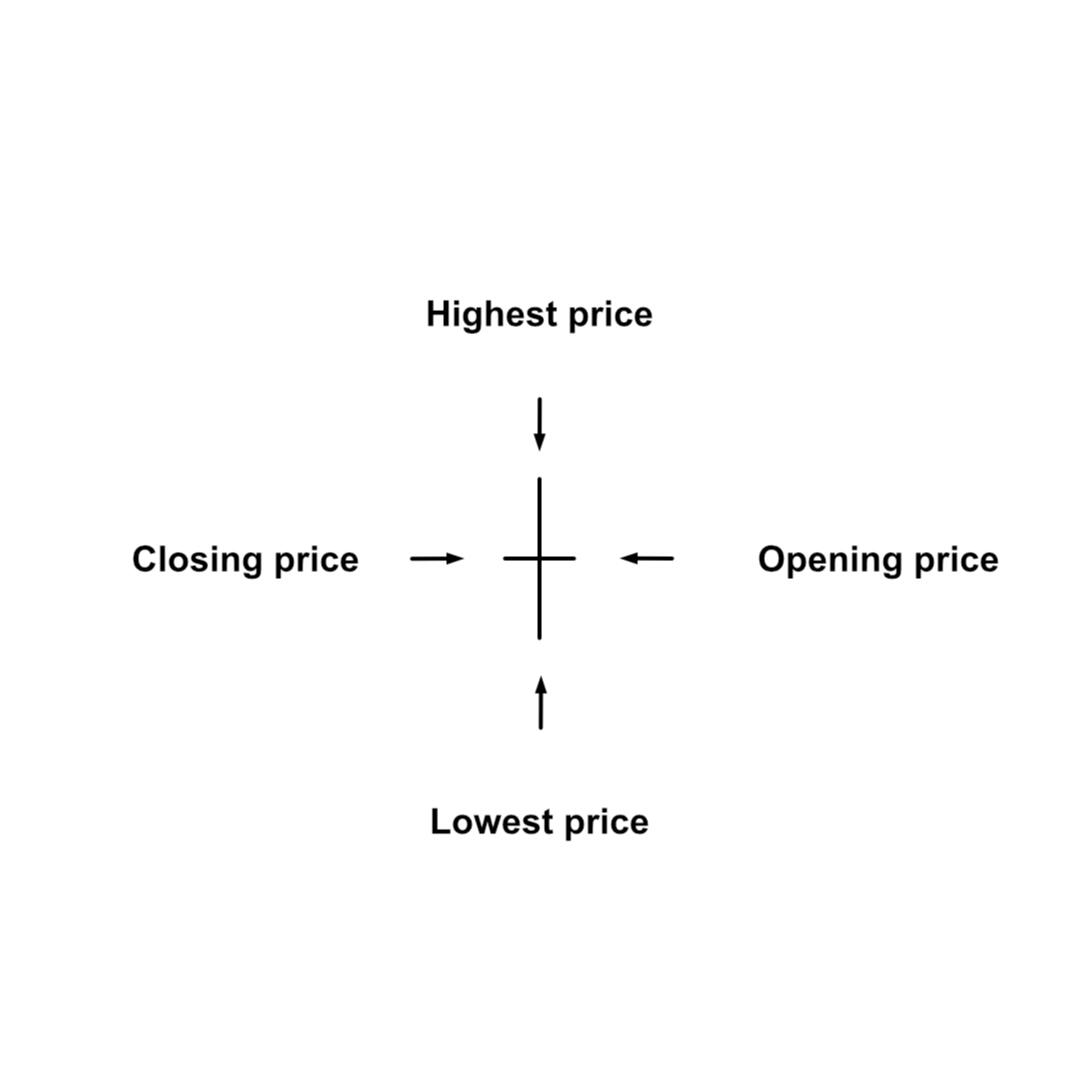
A Doji forms when open and close are nearly equal, showing indecision. After a strong trend, it can signal a possible reversal.
Doji Candle Pattern
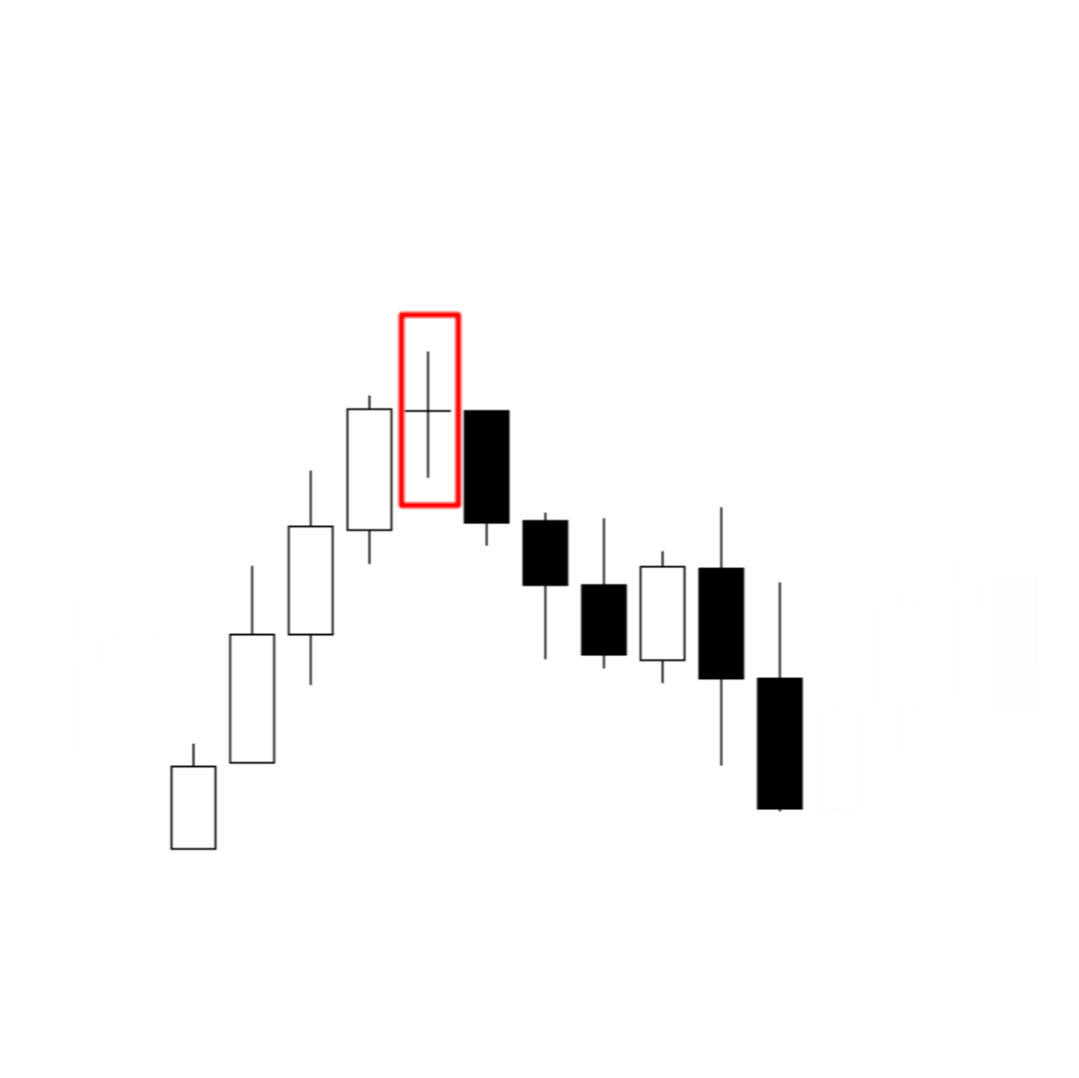
A Doji forms when open and close align, showing indecision. In an uptrend it can mean buyers losing control; in a downtrend, sellers losing momentum. It may suggest reversal, but confirm with other tools.
Dragonfly Doji Candle
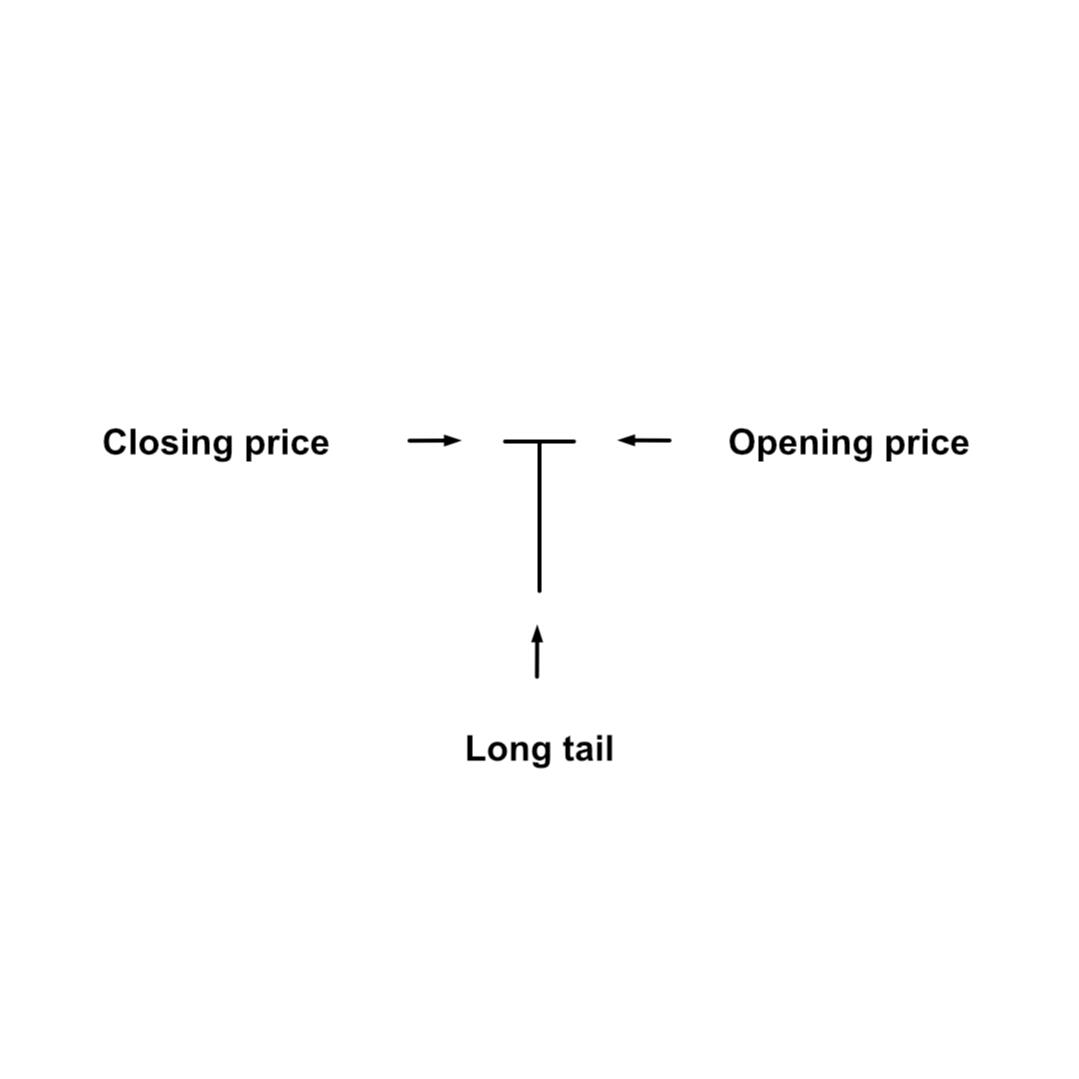
A Dragonfly Doji forms when open, high, and close align, leaving a long lower shadow. It shows buyers rejecting lower prices and often signals a bullish reversal in a downtrend.
Dragonfly Doji Pattern
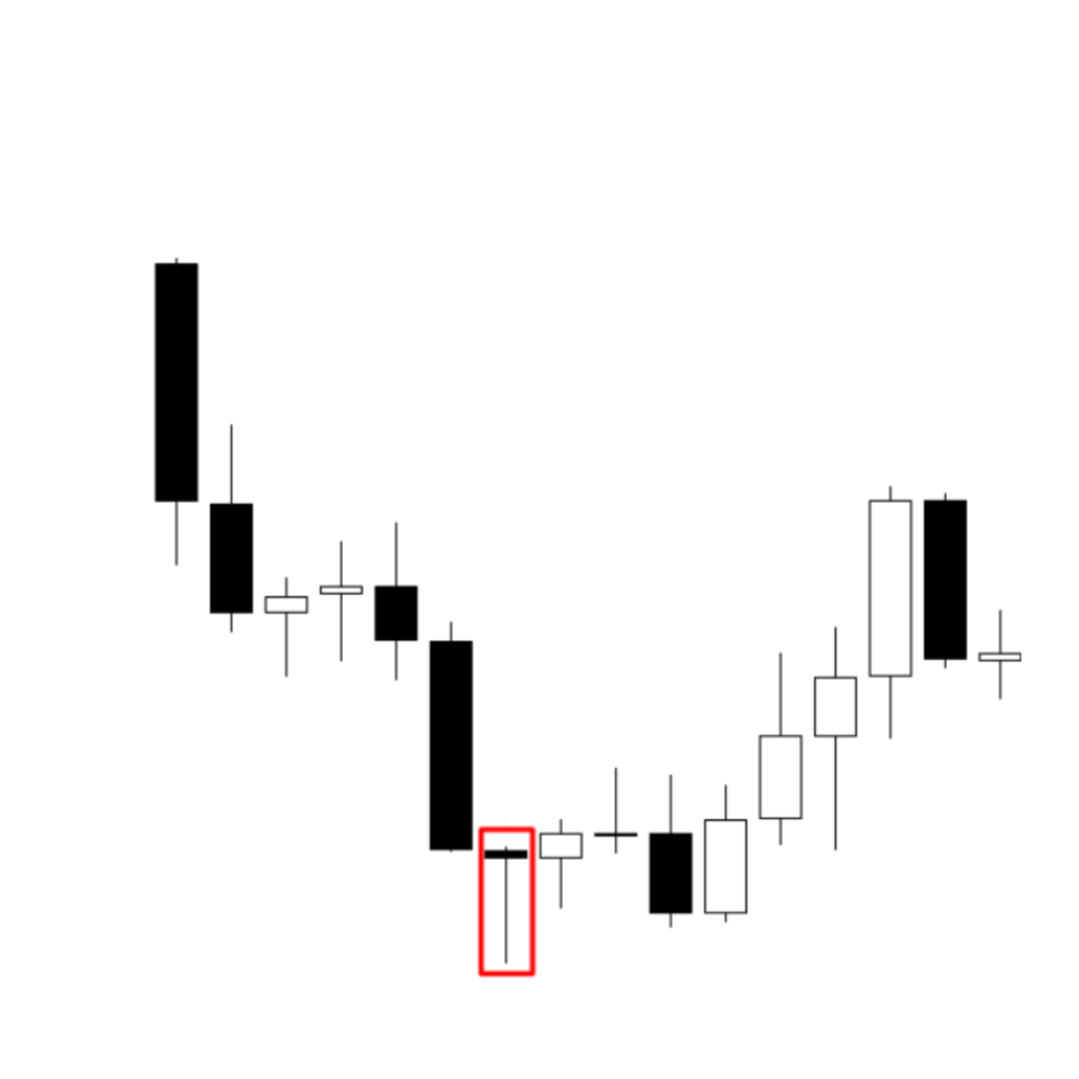
A Dragonfly Doji Pattern often shows at support in a downtrend. The long lower shadow signals buyers rejecting lows and a possible bullish reversal.
Gravestone Doji Candle
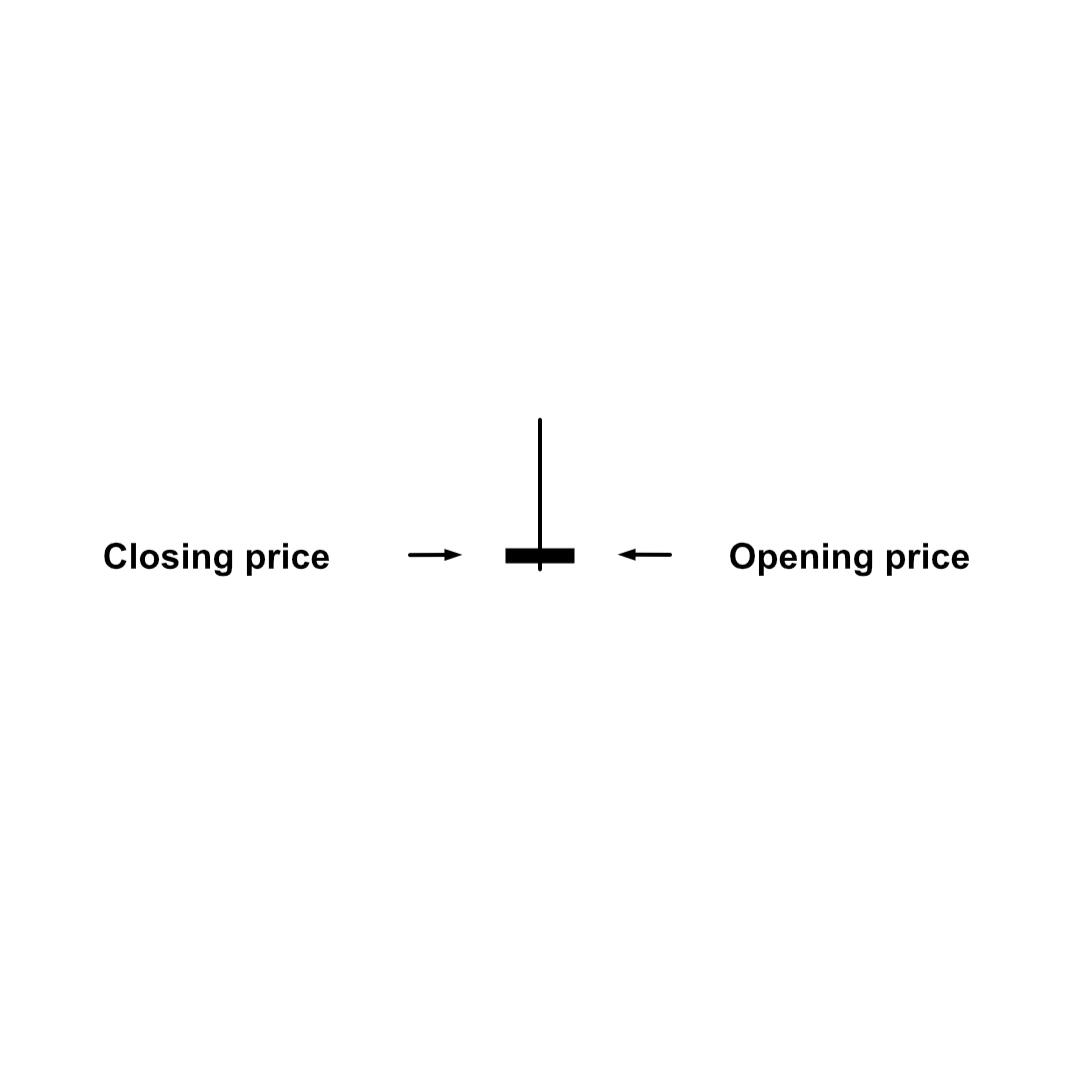
A Gravestone Doji forms when open and close align with a long upper shadow. It shows sellers rejecting highs and can signal a bearish reversal in an uptrend.
Gravestone Doji Pattern
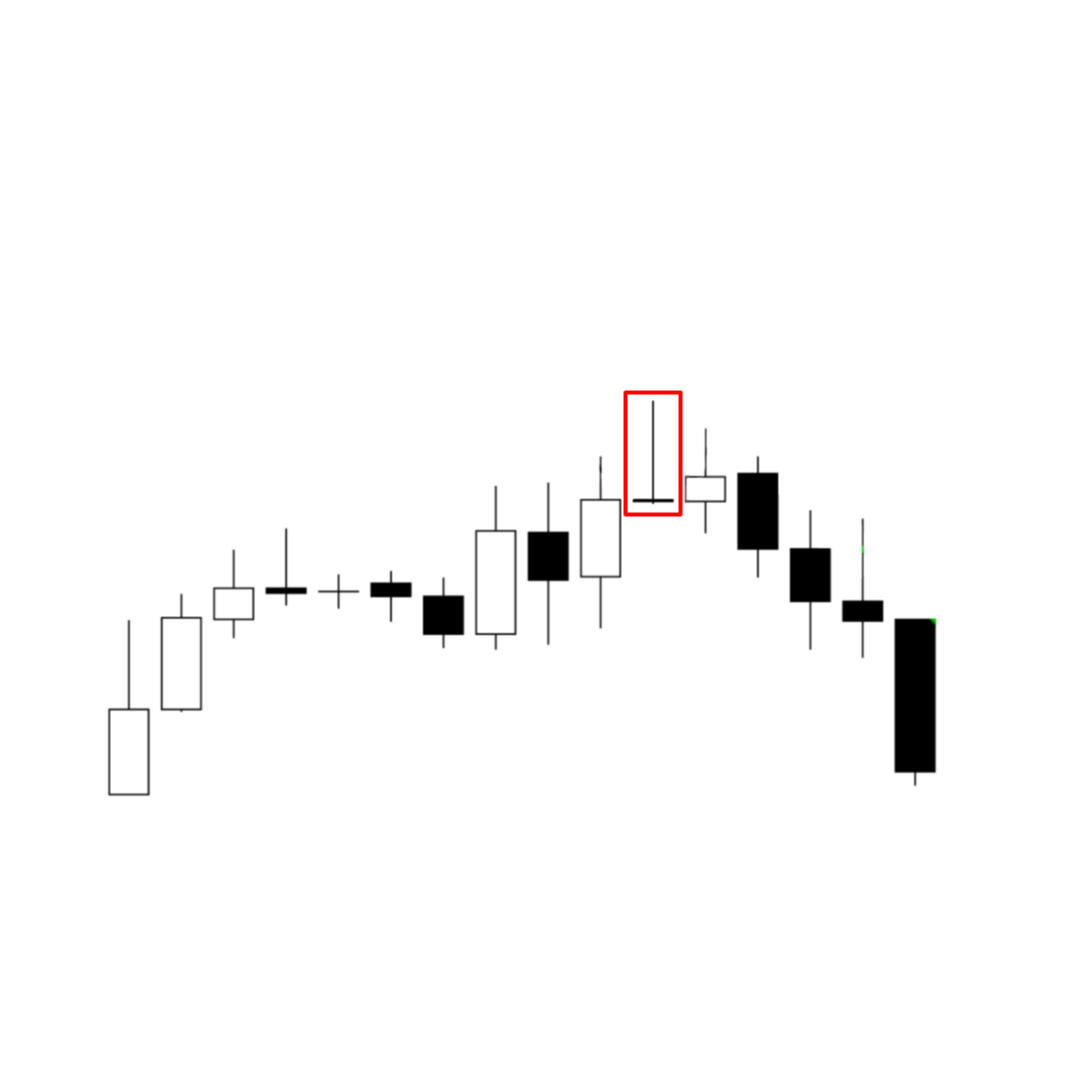
A Gravestone Doji Pattern often appears near resistance in an uptrend. Its long upper shadow shows sellers rejecting highs and signals a possible bearish reversal.
Morning Star
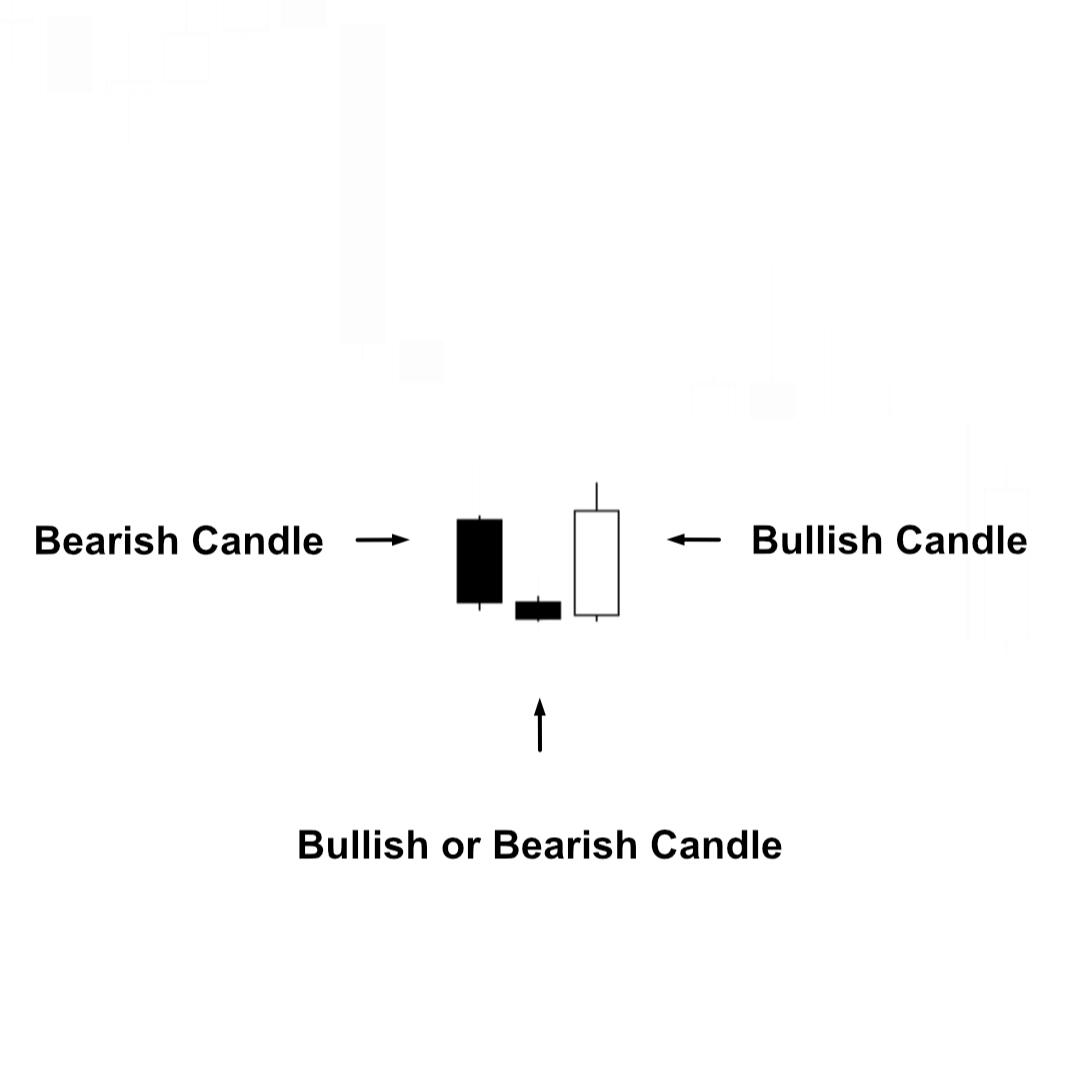
A Morning Star is a three-candle bullish reversal at the bottom of a downtrend. A bearish candle shows seller control, a small candle shows fading momentum, and a strong bullish candle closing above the first’s midpoint signals reversal near support.
Morning Star Pattern
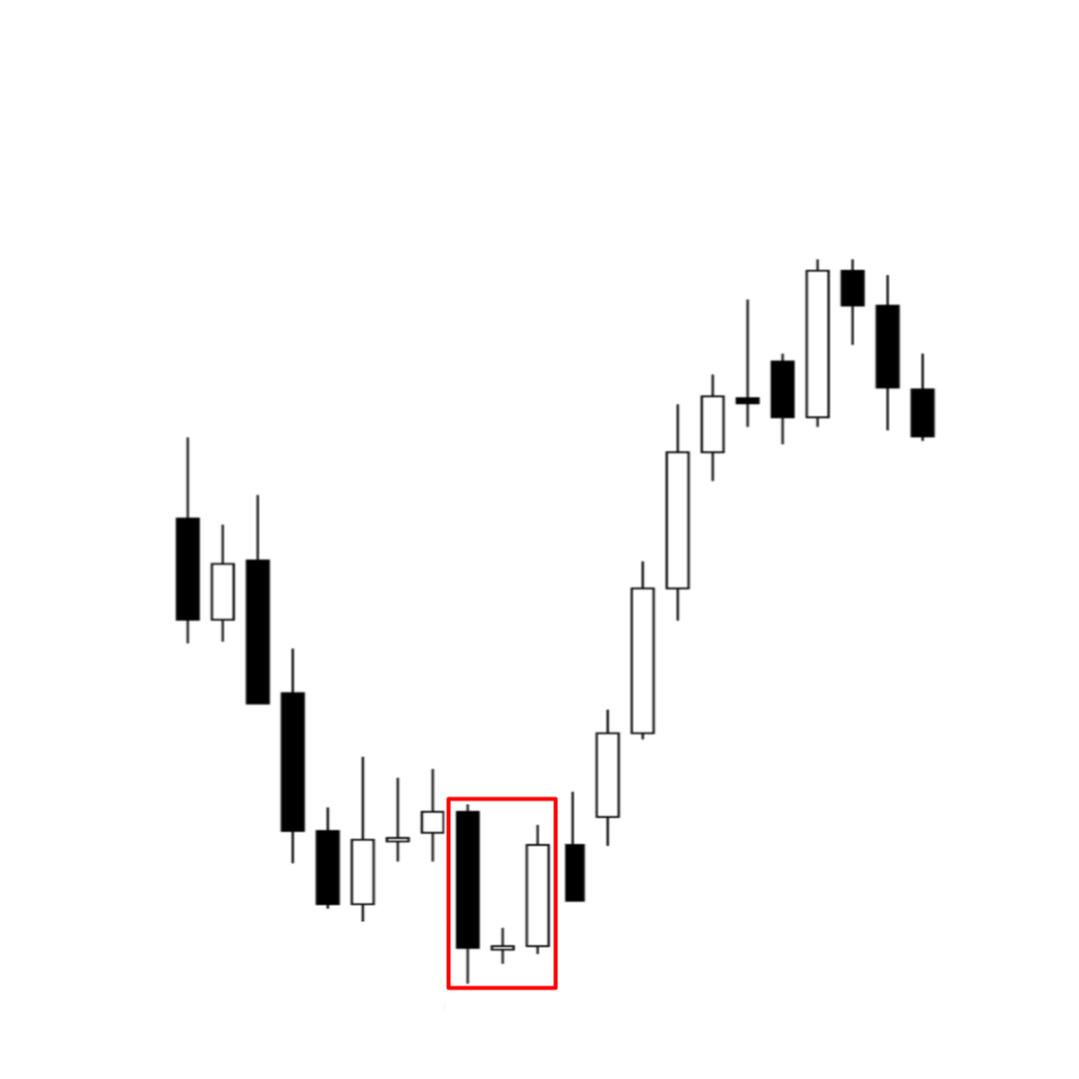
A Morning Star forms at the bottom of a downtrend. Bearish control fades with a small candle, then a strong bullish close confirms reversal.
Evening Star
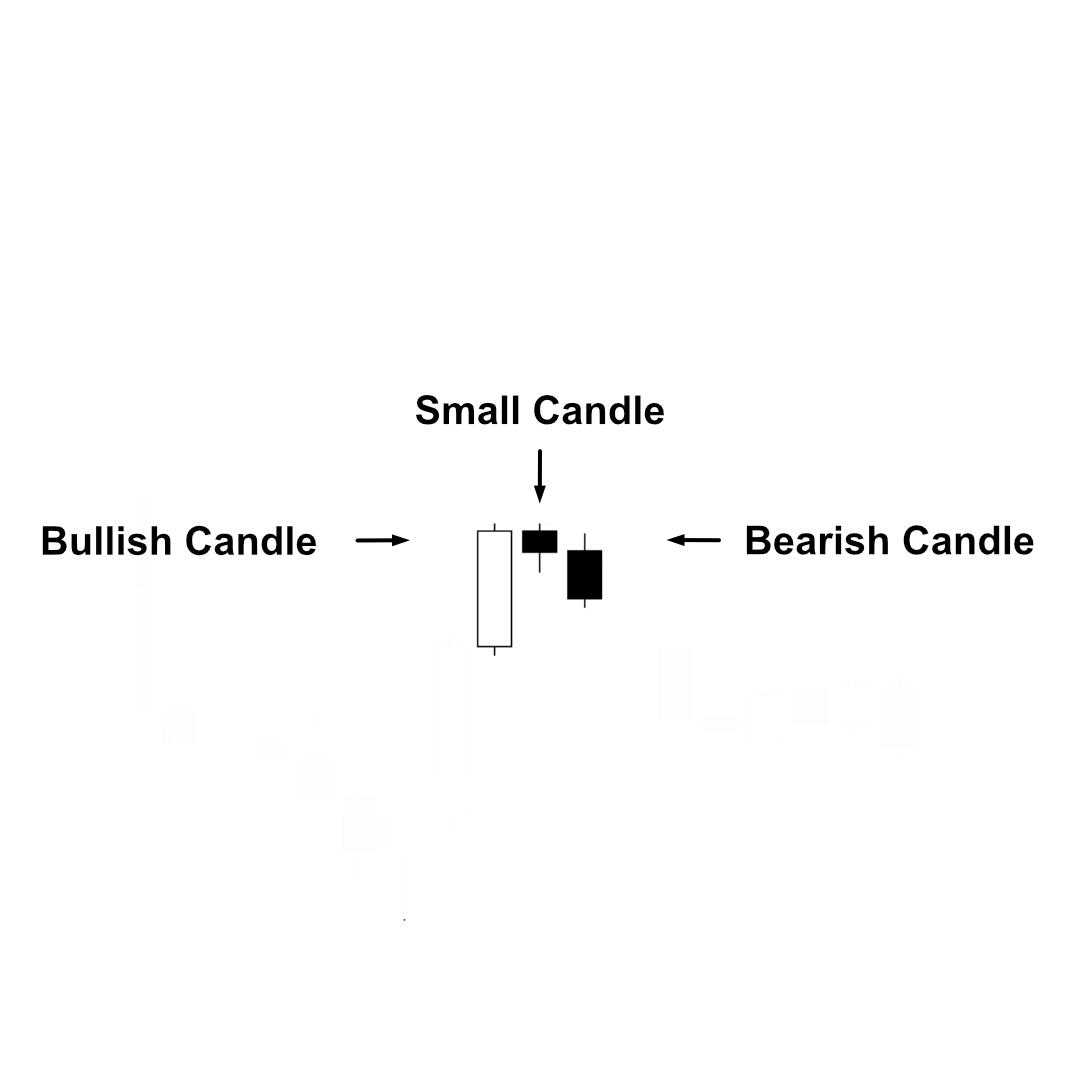
An Evening Star is a three-candle bearish reversal at the top of an uptrend. A strong bullish candle is followed by indecision, then a bearish close below the first’s midpoint signals reversal near resistance.
Evening Star Pattern
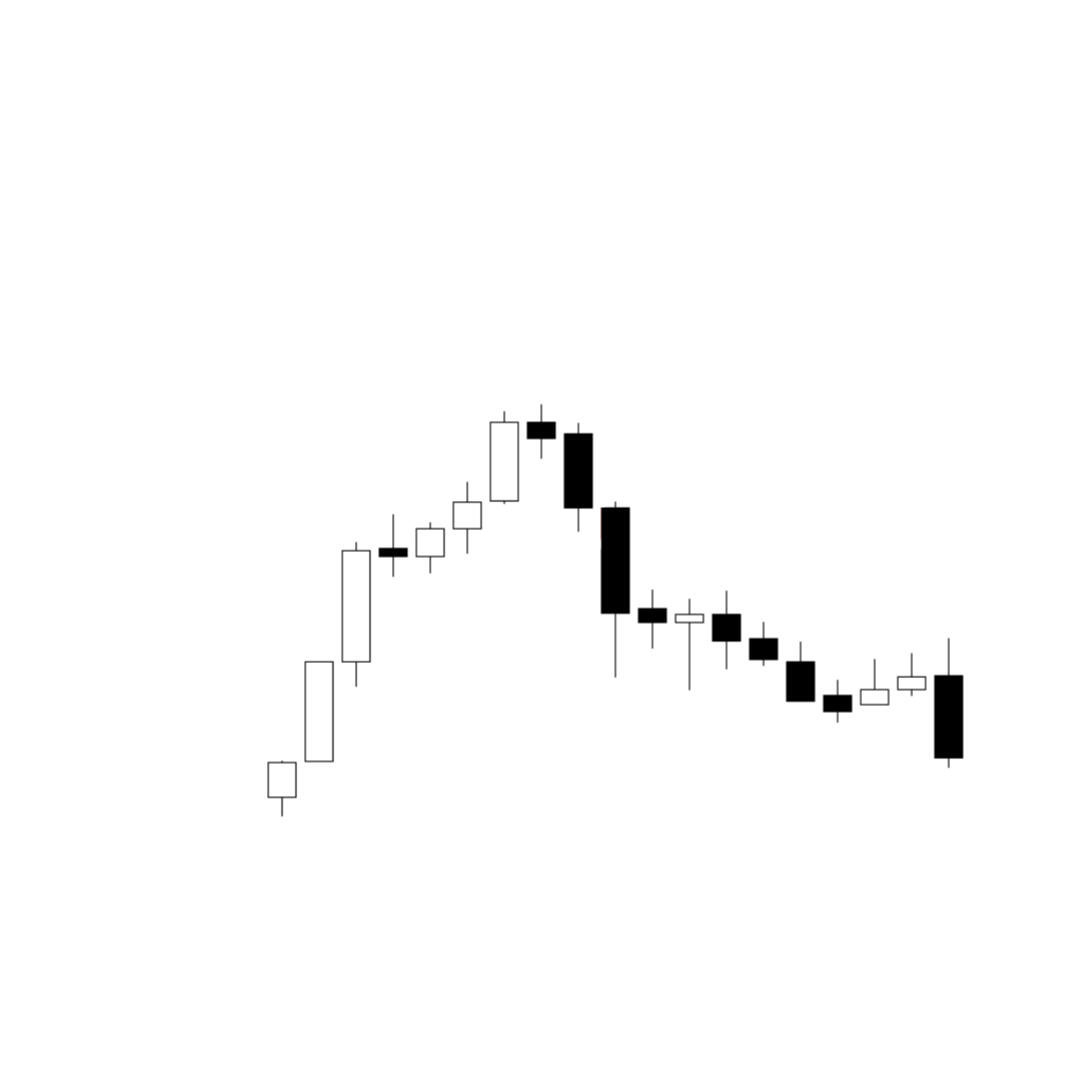
The Evening Star Pattern forms at the top of an uptrend. A strong bullish candle is followed by indecision, then a bearish close below the first’s midpoint confirms reversal.
Hammer
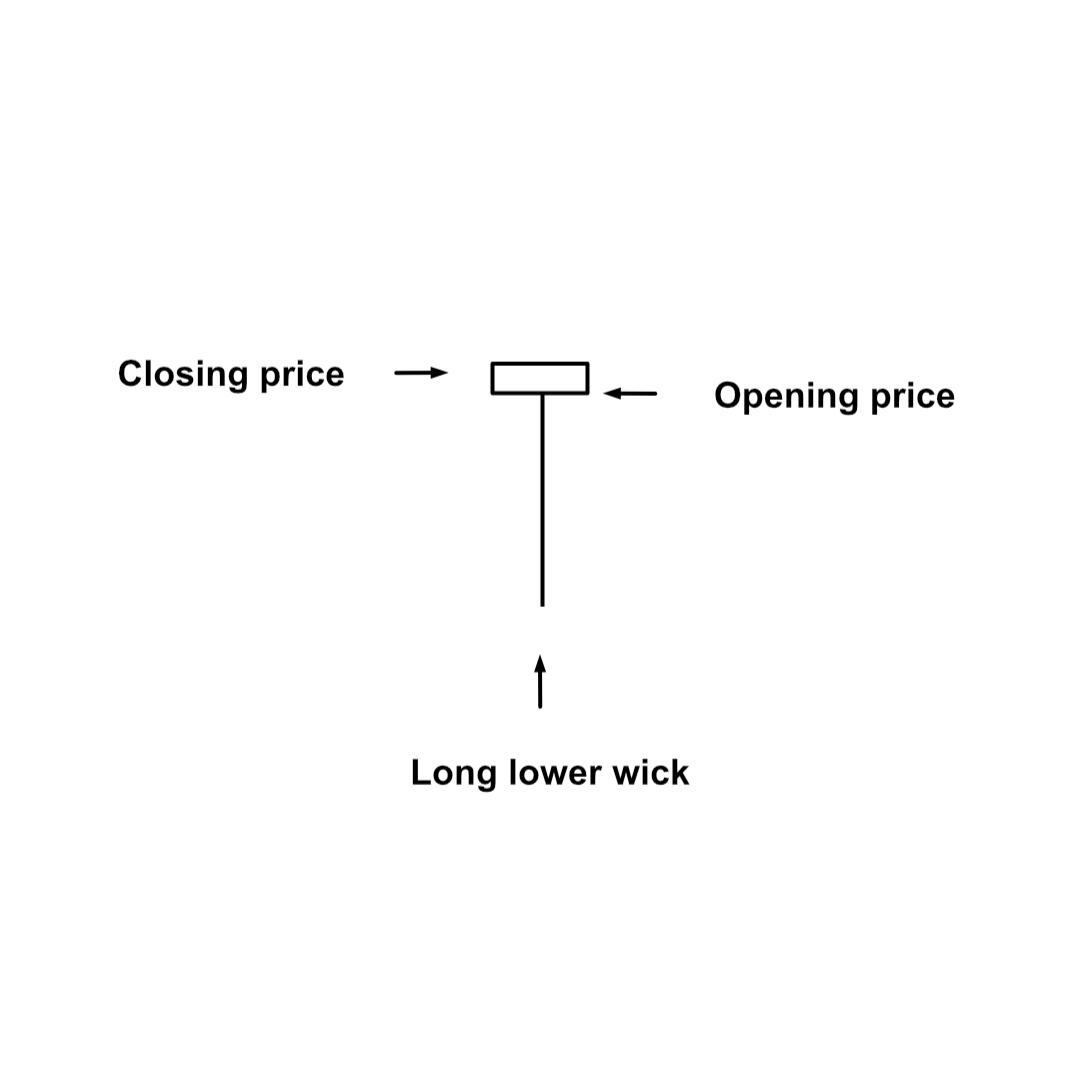
A Hammer forms when open, high, and close align with a long lower shadow. It shows buyers rejecting lows and can signal a bullish reversal in a downtrend.
Hammer Pattern
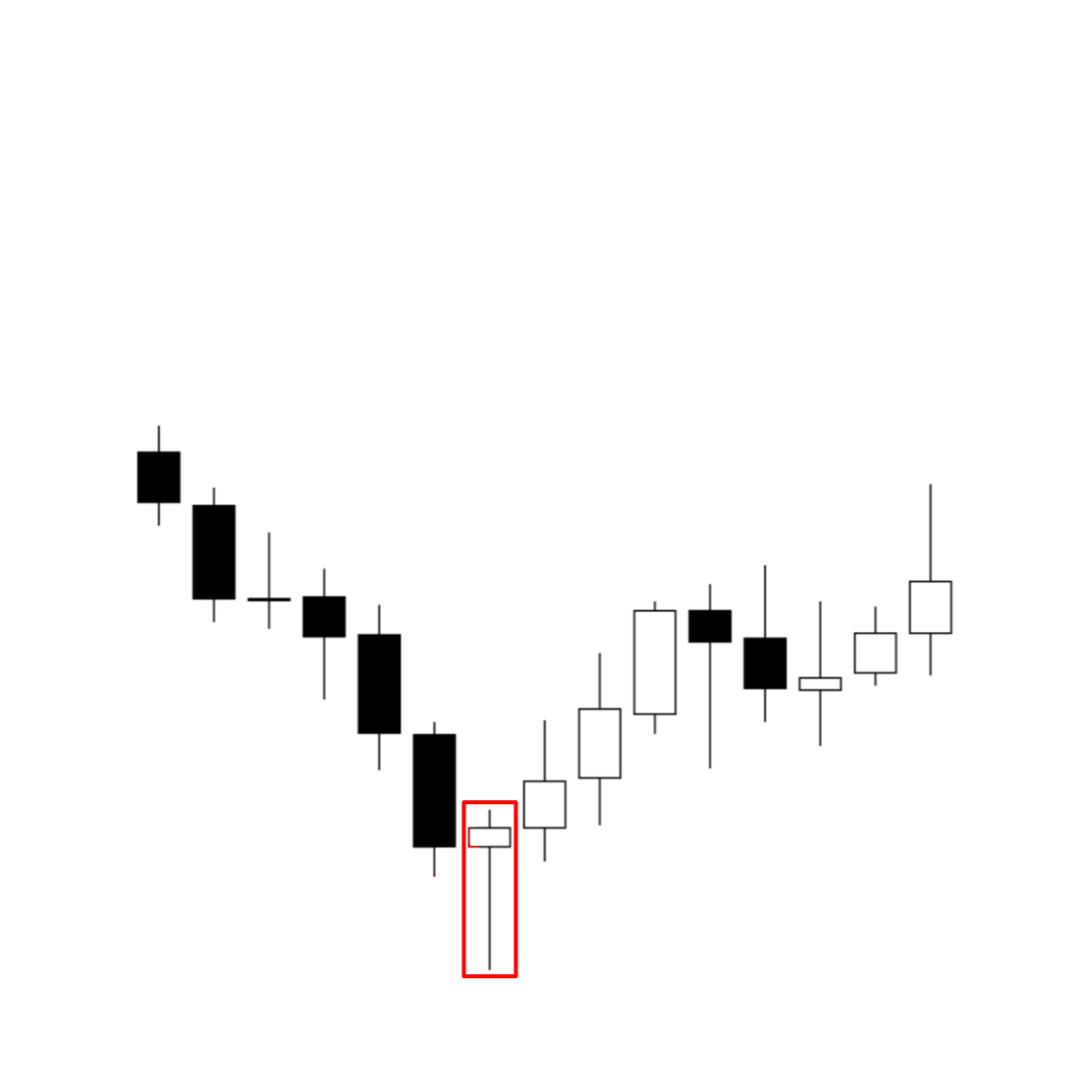
A Hammer Pattern often appears at the bottom of a downtrend. Its long lower shadow shows buyers rejecting lows and overcoming sellers, signaling a possible bullish reversal.
Shooting Star
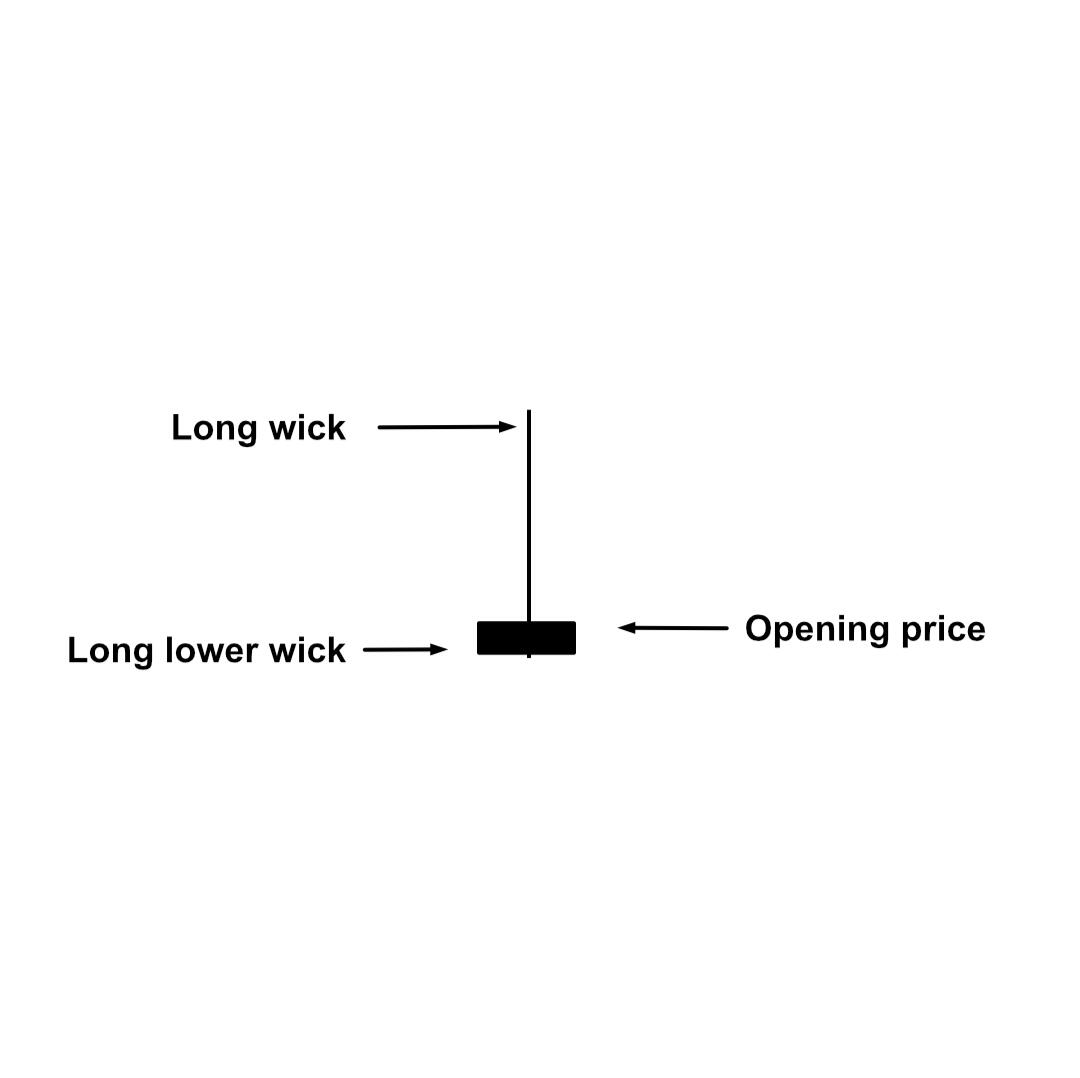
A Shooting Star forms near the top of an uptrend with a small body and long upper shadow. It shows buyers pushing higher but sellers rejecting those levels, often signaling a bearish reversal.
Shooting Star Pattern
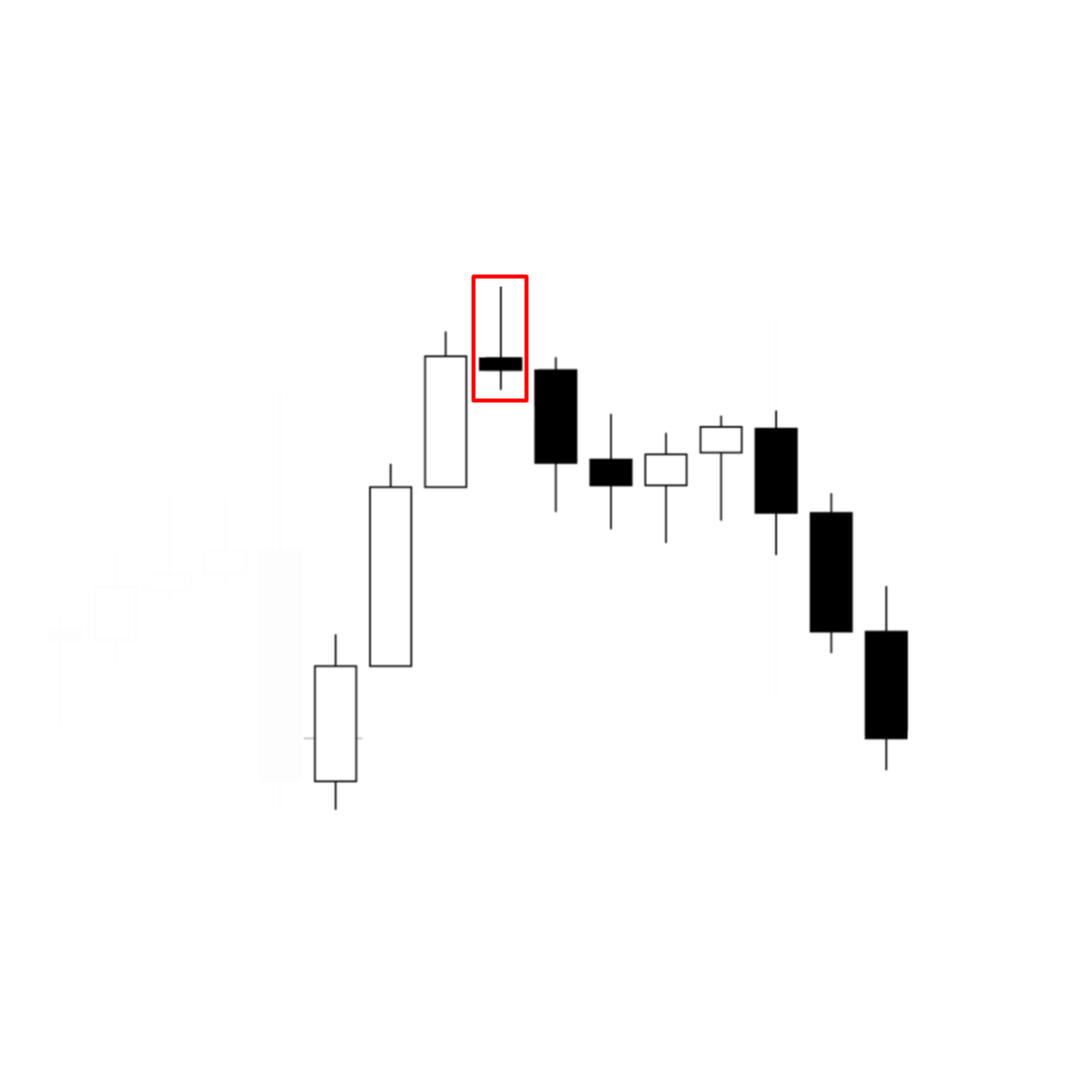
A Shooting Star Pattern often appears near resistance in an uptrend. Its long upper shadow shows sellers rejecting highs and signals a possible bearish reversal.
Bullish Harami
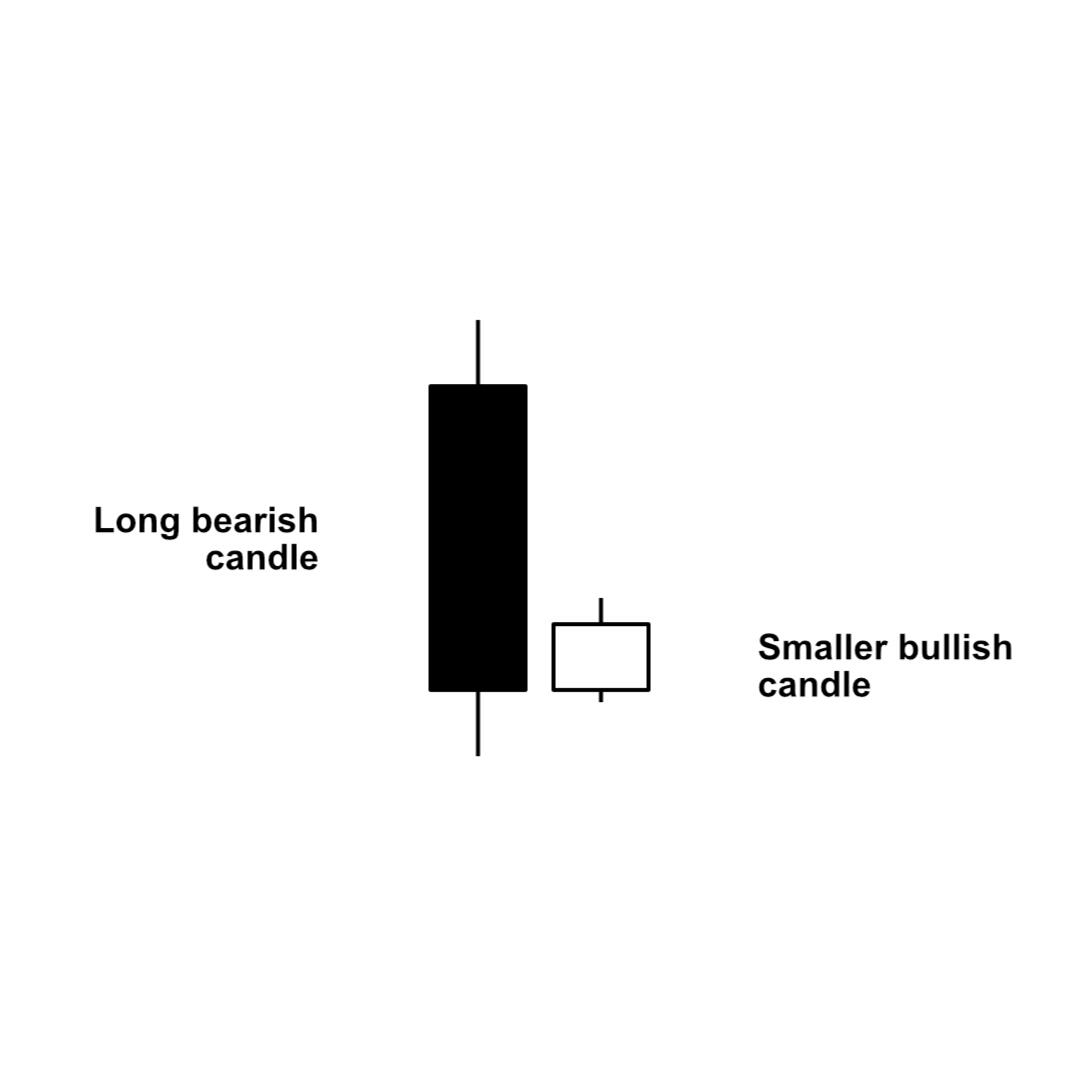
A Bullish Harami is a two-candle reversal at the bottom of a downtrend. A large bearish candle is followed by a smaller one inside it, showing sellers losing momentum and buyers starting to take control.
Bullish Harami Pattern
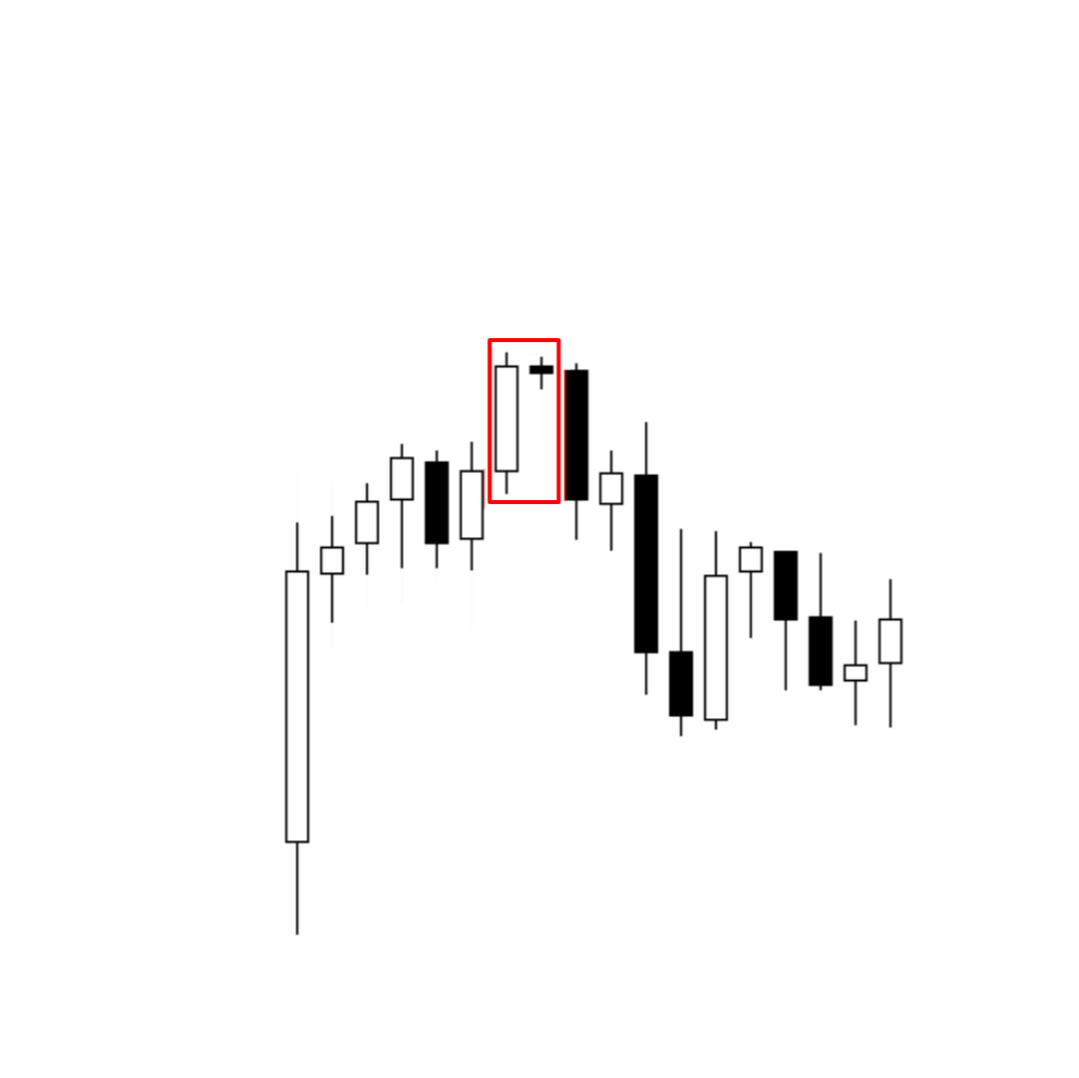
A Bullish Harami Pattern often forms at the bottom of a downtrend. A large bearish candle followed by a smaller one inside it shows sellers losing control and signals a possible bullish reversal.
Bearish Harami
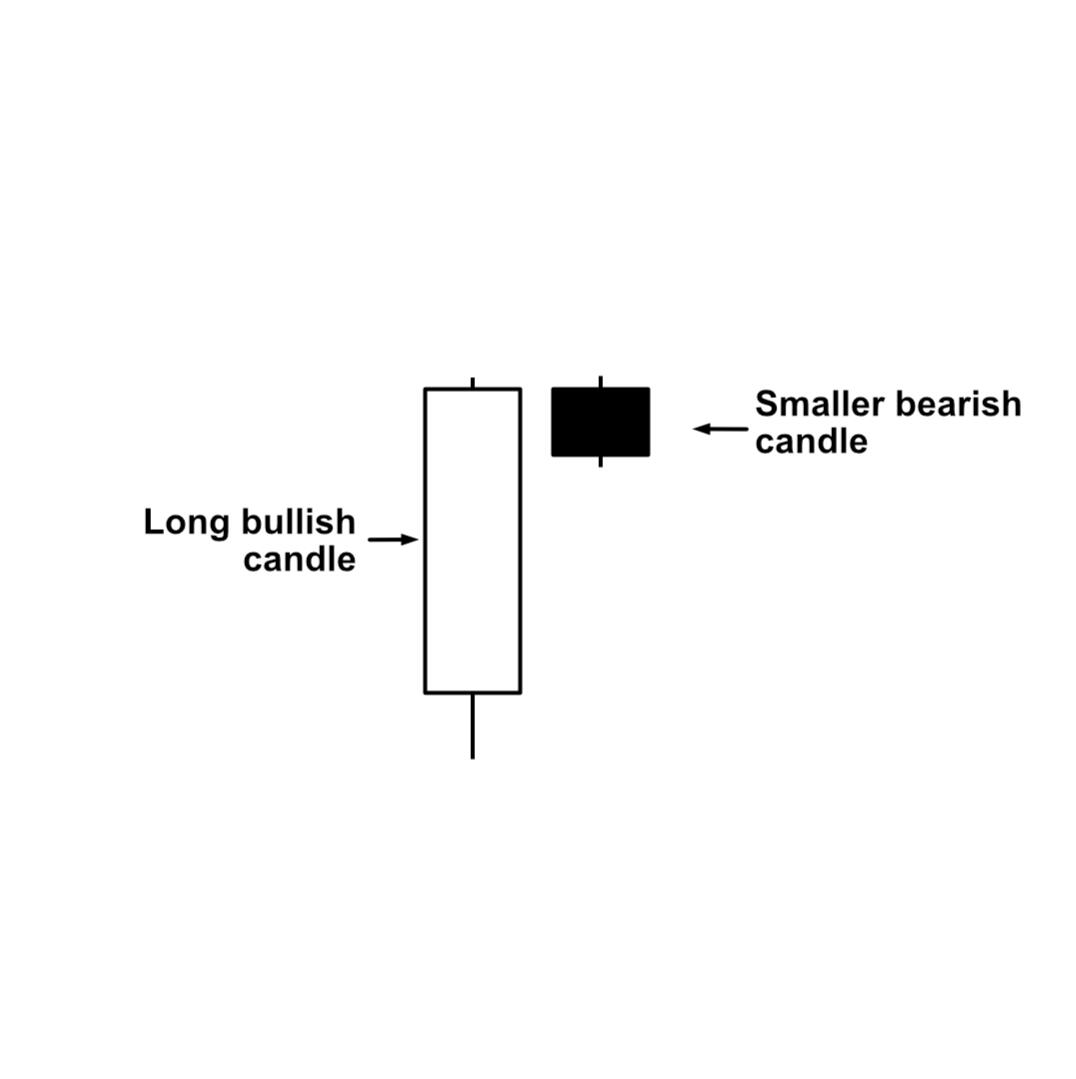
A Bearish Harami is a two-candle reversal at the top of an uptrend. A large bullish candle followed by a smaller one inside it shows fading momentum and signals sellers taking control.
Bearish Harami Pattern
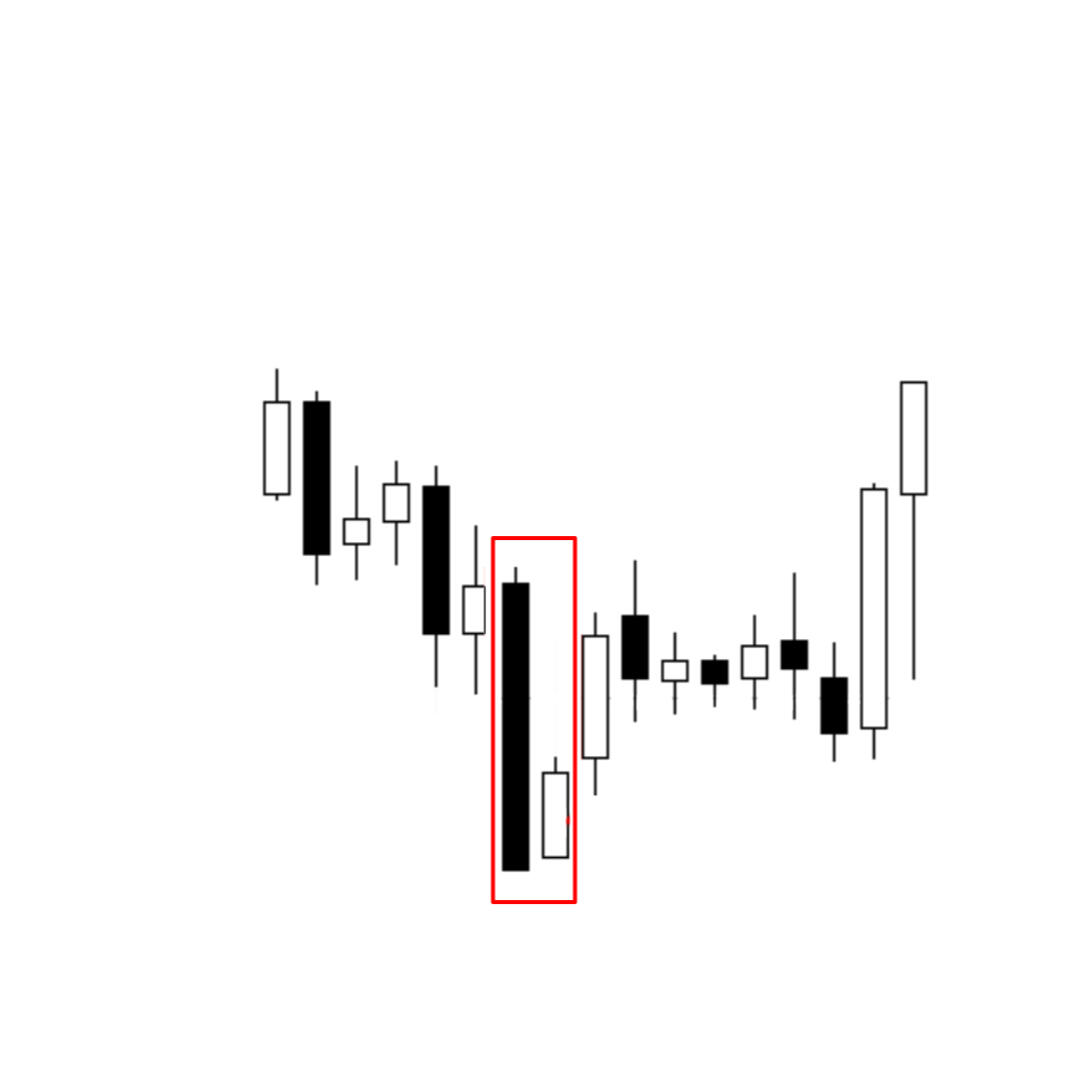
A Bearish Harami Pattern often forms at the top of an uptrend. A large bullish candle followed by a smaller one inside it shows buyers losing momentum and signals a possible bearish reversal.
Tweezer Top
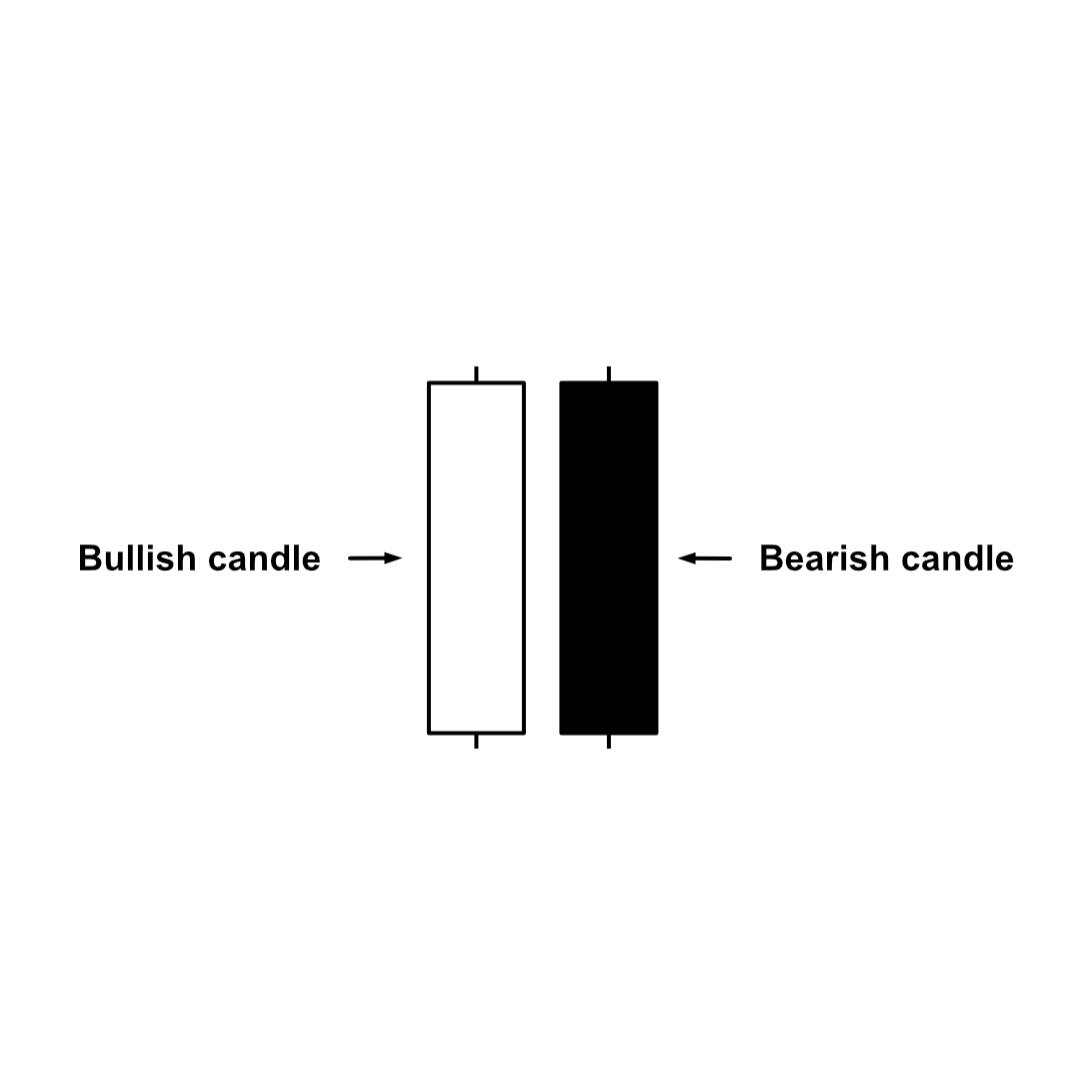
A Tweezer Top is a two-candle reversal at the end of an uptrend. Two highs align at nearly the same level, showing strong resistance and signaling a possible bearish reversal.
Tweezer Top Pattern
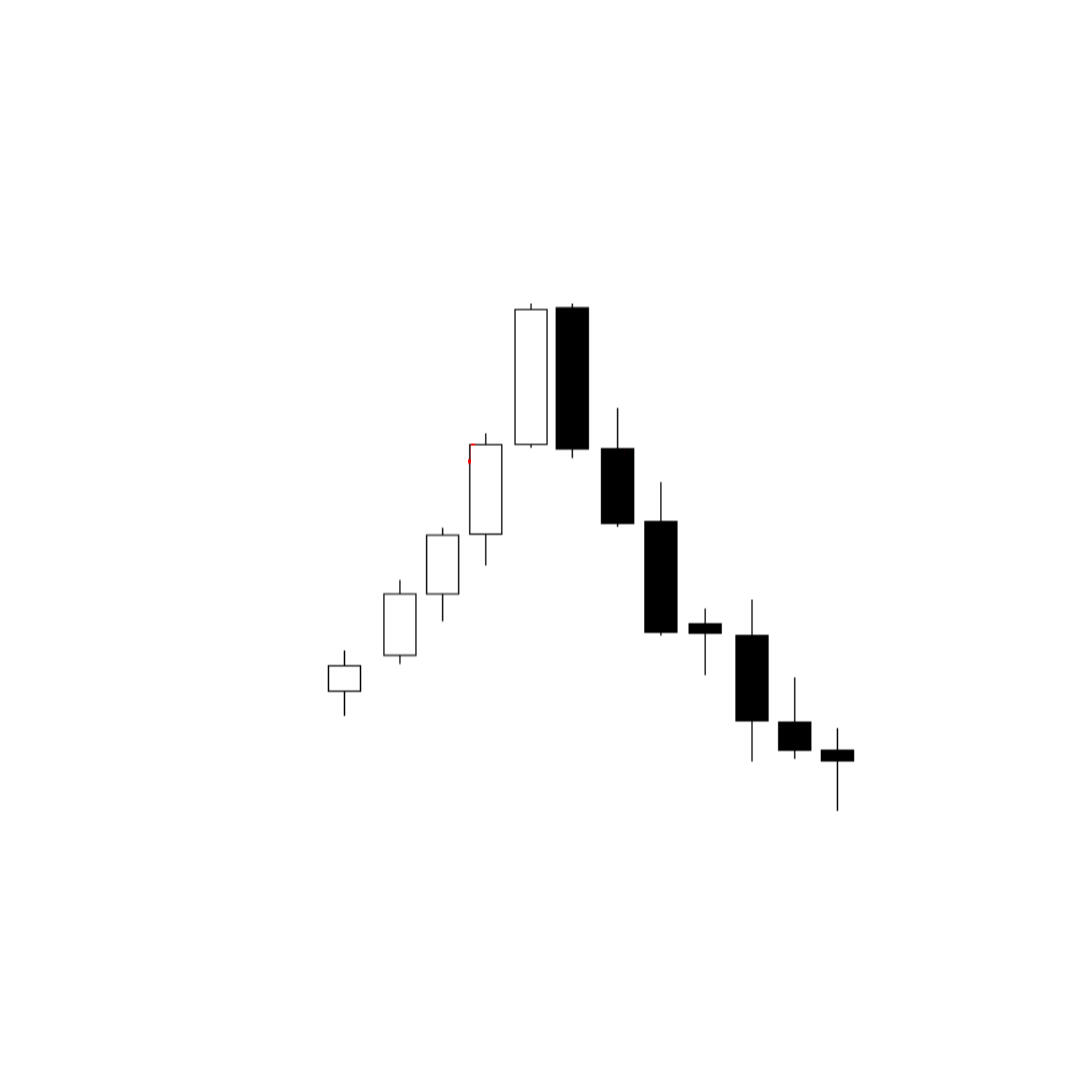
A Tweezer Top forms near resistance when two highs match, showing rejection and signaling a possible bearish reversal.
Tweezer Bottom
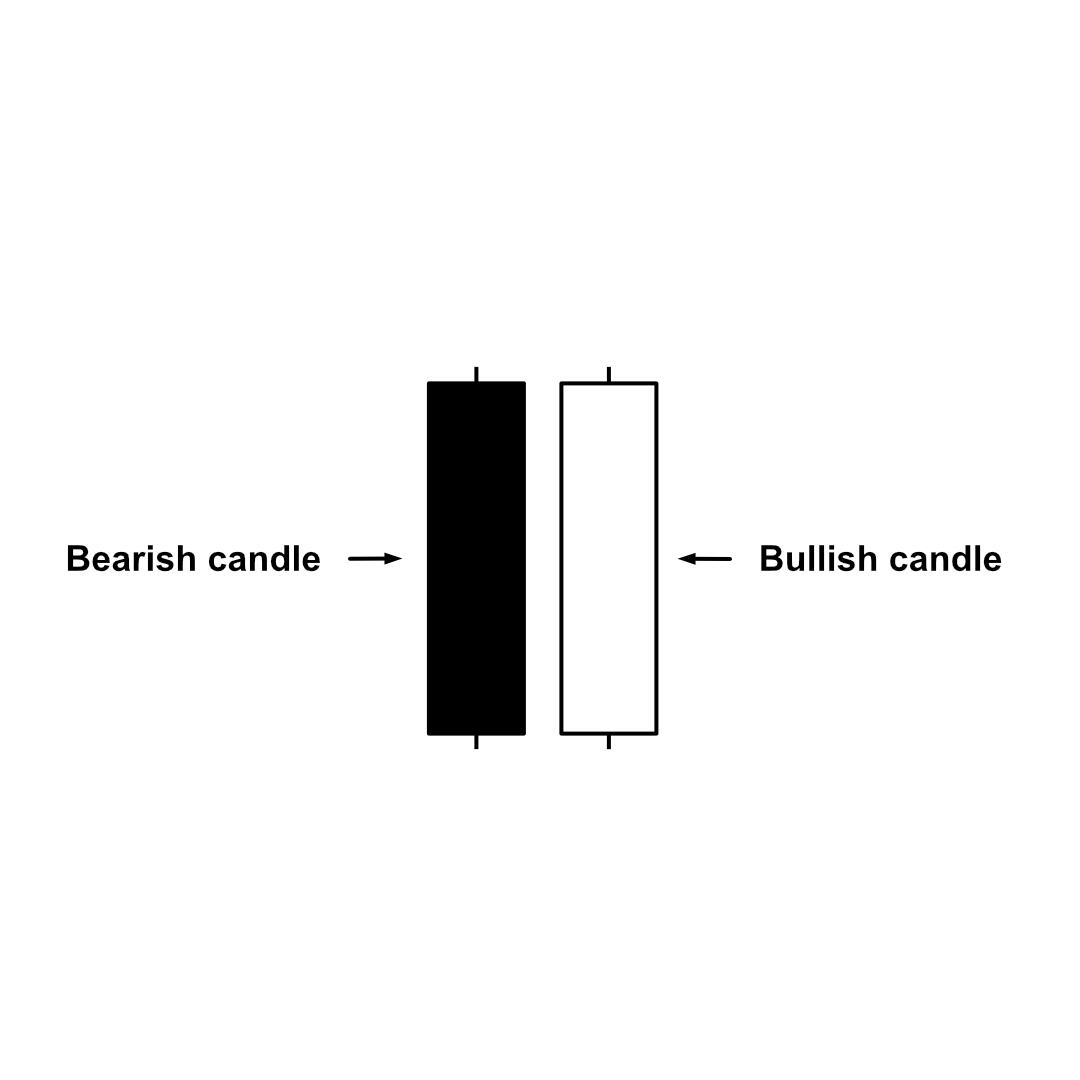
A Tweezer Bottom is a two-candle reversal at the end of a downtrend. Two lows align at nearly the same level, showing support and a possible bullish reversal.
Tweezer Bottom Chart
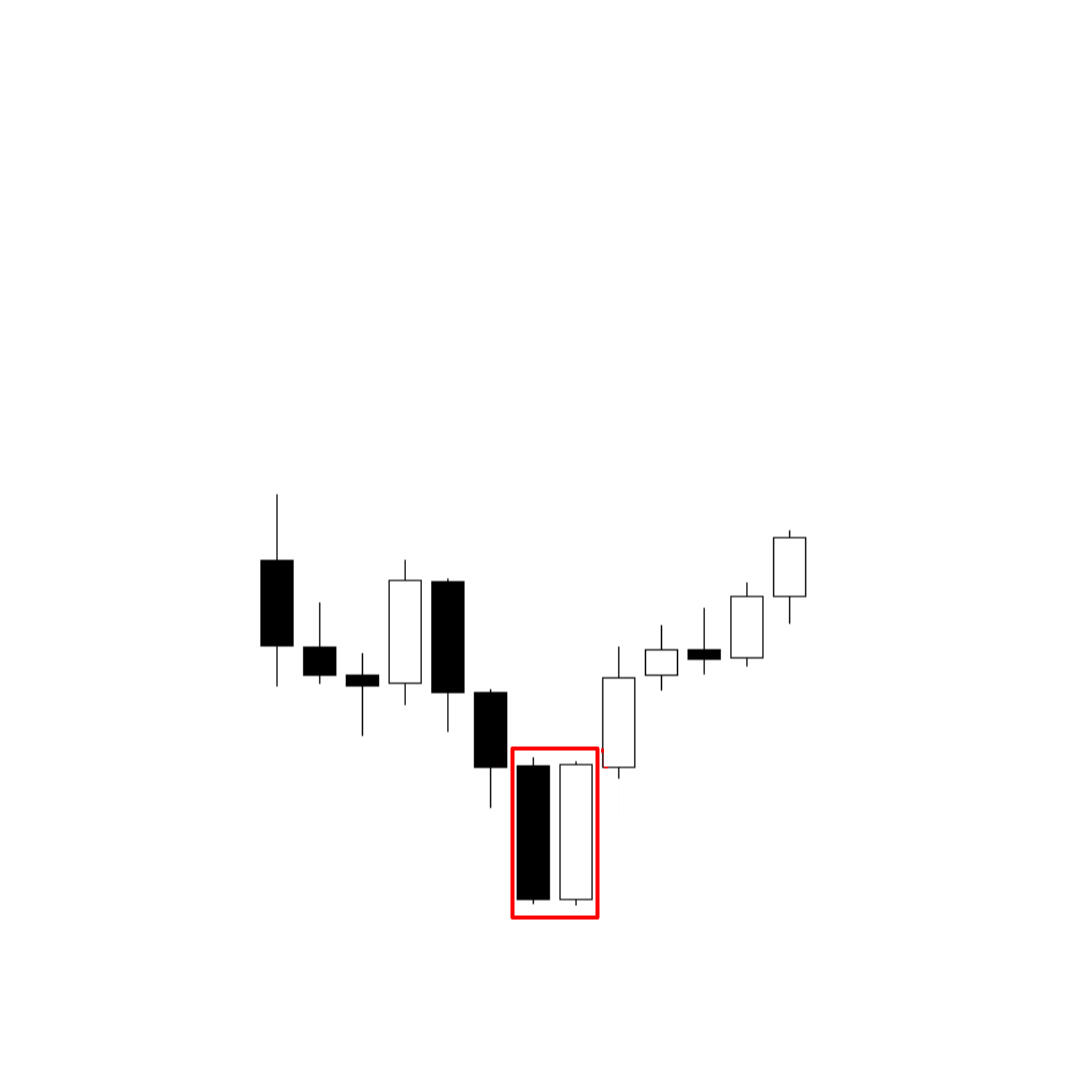
A Tweezer Bottom often forms near support in a downtrend. Two candles hit the same low, showing rejection and signaling a possible bullish reversal.
Tradingview Indicators
A mirror of the past, not a signal for the future.
Plots up to 7 EMAs with standard deviation channels. Helps spot volatility, dynamic support and resistance, and trend strength across multiple timeframes.
Created by TradeTravelChill, this add-on replaces chart volume with Binance Perpetual Futures data. It makes PVSRA — Price, Volume, Support and Resistance Analysis — cleaner, faster, and more accurate.
A dynamic indicator that auto-detects support and resistance from pivots. It ranks zones by strength, shows only the key levels in real time, and updates as price moves, clean charts, clear reactions.
A multi-purpose tool that combines moon phases, market sessions, day separators, and alerts in one script. Built on the Trade by Design method, it’s made for structure-based intraday trading with clean visuals and time-based confluence.
Maps traded volume across price levels, showing value areas, high-volume nodes, and low-volume gaps. Customizable and precise, it helps spot support, resistance, and breakout zones at a glance.
Maps liquidation zones from open interest data, grouping them into clear zones instead of scattered levels. Color gradients show where liquidity stacks, giving traders an instant view of price magnets and targets.
A momentum oscillator that runs Stochastic on RSI instead of price. More sensitive than standard RSI, it highlights overbought/oversold zones, trend shifts, and early reversal signals.
A simple 5-period Moving Average for quick momentum reads, pullbacks, and trend checks. Clean, responsive, and ideal when you’re limited on indicators.
A classic momentum indicator ranging from 0 to 100. Above 70 signals overbought, below 30 oversold. Smoother than Stochastic RSI, it’s best for confirming broader trend conditions across all assets.
Maps traded volume across price levels, showing value areas, high-volume nodes, and low-volume gaps. Customizable and precise, it helps spot support, resistance, and breakout zones at a glance.
Originally built for Forex, adapted for crypto. Combines PVSRA candles, sessions, EMAs, pivots, ADR, psych levels, and vector zones in one script. Open-source, customizable, and designed to give you the full TR toolkit without stacking indicators.


